The NVIDIA Titan V Preview - Titanomachy: War of the Titans
by Ryan Smith & Nate Oh on December 20, 2017 11:30 AM ESTSynthetic Graphics Performance
Moving on, let’s take a look at the synthetic graphics performance of the Titan V. As this is the first graphics-enabled product using the GV100 GPU, this can potentially give us some insight into the yet-untapped graphics capabilities of the Volta architecture. However the usual disclaimer about earlier drivers and early hardware is very much in effect here: we don’t know for sure how consumer Volta parts will be configured, and in the meantime it’s not clear just how well the Volta drivers have been optimized for graphics.
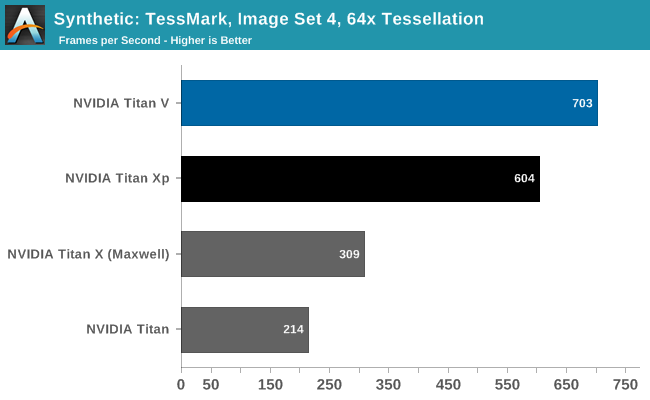
Right now the graphics aspects of the Volta architecture are something of a black box, and tessellation performance with TessMark reflects this. On Pascal, NVIDIA has one Polymorph engine per TPC; if this is the same on GV100, then Titan V has around 40% more geometry hardware than Titan Xp. On the other hand, the actual throughput rate of Polymorph engines has varied over the years as NVIDIA has dialed it up or down in line with their performance goals and the number of such hardware units available. So for all we know, Titan V’s Polymorph engines don’t pack the same punch as Titan Xp’s.
At any rate, Titan V once again comes away with a win. But the 16% lead is not a day-and-night difference, unlike what we’ve seen with compute.
Beyond3D Suite
Meanwhile for looking at texel and pixel fillrate, we have the Beyond3D Test Suite.
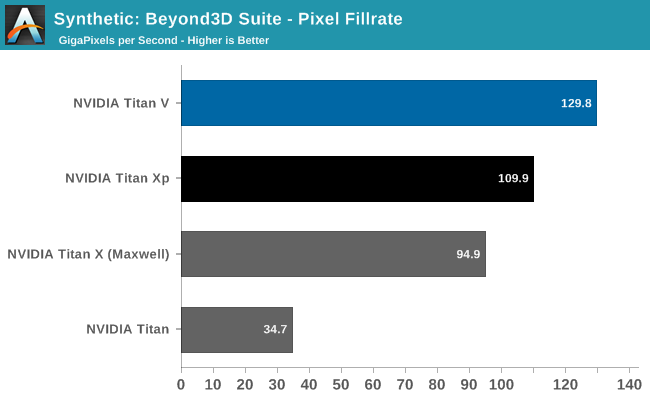
Starting with the pixel throughput benchmark, I’m actually a bit surprised the difference is as great as it is. As discussed earlier, on paper the Titan V has lower ROP throughput than the Titan Xp, owing to lower clockspeeds. And yet in this case it’s still in the lead by 18%. It’s not a massive difference, but it means the picture is more complex than naïve interpretation of GV100 being a bigger Pascal. This may be an under-the-hood efficiency improvement (such as compression), or it could just be due to Titan V’s raw bandwidth advantage. This will be worth keeping an eye on once NVIDIA starts talking about consumer Volta cards.
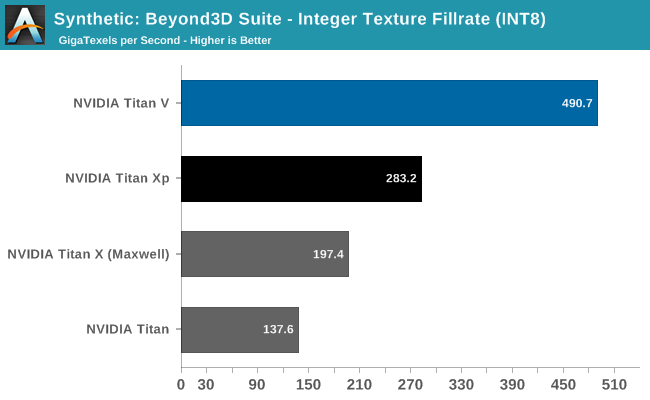
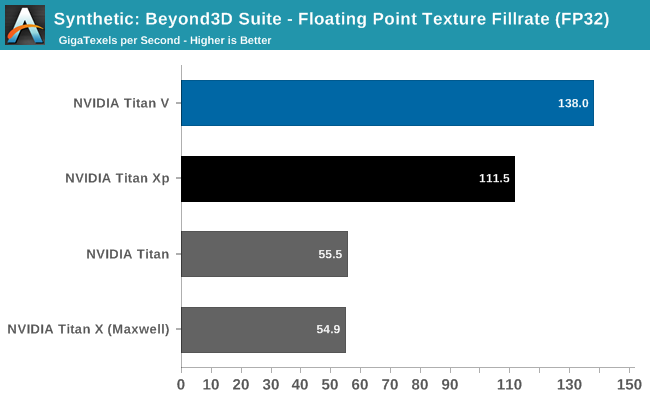
As for texel throughput, it’s interesting that INT8 and FP32 texture throughput gains are so divergent. Titan V is showing much greater INT8 texture throughput gains than it is FP32; and Titan Xp was no slouch in that department to begin with. I’m curious whether this is a product of separating the integer ALUs from the FP ALUs on Volta, or whether NVIDIA has made some significant changes to their texture mapping units.
3DMark Fire Strike Ultra
I’ve also gone ahead and run Futuremark’s 3DMark Fire Strike Ultra benchmark on the Titans. This benchmark is a bit older, but it’s a better understood (and better optimized) DX11 benchmark.
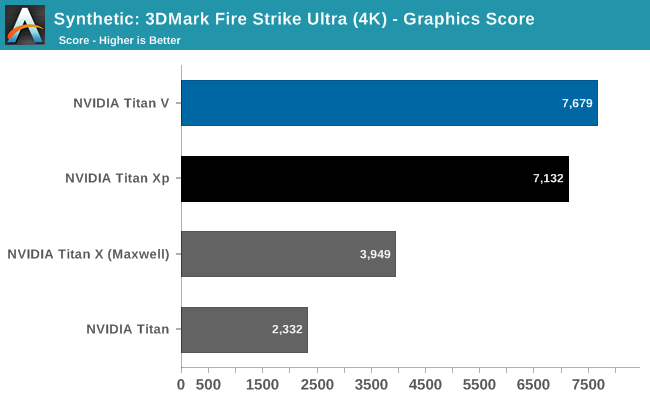
The results here find the Titan V in the lead, but not by much: just 8%. Relative to Pascal/Titan Xp, Titan V’s performance advantages and architectural improvements are inconsistent, in as much as not everything has been improved to the same degree. These results point to a bottleneck elsewhere – perhaps the ROPs? – but don’t isolate it. More significantly though, it’s an indication that while Titan V can do graphics, perhaps it’s not well-built (or at least well-optimized) for the task.
SPECViewPerf 12.1.1
Finally, while SPECViewPerf’s component software packages are more for the professional visualization side of the market – and NVIDIA doesn’t optimize the GeForce driver stack for these programs – I wanted to quickly run all of the Titans through the test all the same, just to see what we’d get.
| NVIDIA Titan Cards SPECviewperf 12.1 FPS Scores | ||||||
| Titan V | Titan Xp | GTX Titan X | GTX Titan | |||
| 3dsmax-05 | 176.3 | 173.7 | 133.1 | 100.3 | ||
| catia-04 | 180.3 | 181.4 | 71.3 | 24.1 | ||
| creo-01 | 119.4 | 122.1 | 41.0 | 30.1 | ||
| energy-01 | 27.7 | 21.2 | 8.7 | 5.8 | ||
| maya-04 | 159.0 | 152.0 | 131.6 | 98.6 | ||
| medical-01 | 89.4 | 91.9 | 39.9 | 27.7 | ||
| showcase-01 | 175.5 | 167.0 | 98.7 | 67.0 | ||
| snx-02 | 223.2 | 225.3 | 7.37 | 4.1 | ||
| sw-03 | 110.1 | 100.7 | 52.2 | 41.3 | ||
The end result is actually quite interesting. The Titan V only wins a bit more than it loses, as the card doesn’t pick up much in the way of performance versus the Titan Xp. Professional visualization tasks tend to be more ROP-bound, so this may be a consequence of that, and I wouldn’t read too much into this versus anything Quadro (or what a Quadro GV100 card could do). But it illustrates once again how Titan V has improved at some tasks by more than it has in others.


111 Comments
View All Comments
mode_13h - Wednesday, December 27, 2017 - link
How much of that could be due to the disabled HBM2 stack? Since the GPU was designed to have 4 fully-functional stacks, perhaps there are some bottlenecks when running it with only 3.Golgatha777 - Sunday, December 24, 2017 - link
It's a monster card and the best by definition. It's also a terrible value proposition.FreckledTrout - Wednesday, December 20, 2017 - link
Nice sense of humor with the "But Can It Run Crysis?" tab. First card that can pull 60fps on Crysis at 4k.Pork@III - Wednesday, December 20, 2017 - link
"First card that can pull 60fps on Crysis at 4k"Such a video card is not possible to exist. :)
tipoo - Wednesday, December 20, 2017 - link
Does that mean we can now kill that meme in the comments?Ian Cutress - Wednesday, December 20, 2017 - link
Back when it was released, it was all about running 1080p Max.Today it's running 4K Max.
Next challenge is 8K Max settings, given the Dell UP3218K exists.
jabbadap - Wednesday, December 20, 2017 - link
Funny 2160p with 4x SSAA is actually rendering at 7680x4320(aka not so really "8K") and scaling it back to 2160p...Ryan Smith - Wednesday, December 20, 2017 - link
Of course we'll need to run it with 4x SSAA at 8K, to ensure there are no jaggies...HollyDOL - Wednesday, December 20, 2017 - link
I'd need a microscope to tell a difference at that resolution.jbo5112 - Thursday, December 21, 2017 - link
Yes, but what about those of us who want to run Crysis on 3 of the 8k Dell UP3218K monitors?