The Ampere Altra Max Review: Pushing it to 128 Cores per Socket
by Andrei Frumusanu on October 7, 2021 8:00 AM EST- Posted in
- Servers
- Arm
- Neoverse N1
- Ampere
- Altra Max
Compiling Performance / LLVM
As we’re trying to rebuild our server test suite piece by piece – and there’s still a lot of work go ahead to get a good representative “real world” set of workloads, one more highly desired benchmark amongst readers was a more realistic compilation suite. Chrome and LLVM codebases being the most requested, I landed on LLVM as it’s fairly easy to set up and straightforward.
git clone https://github.com/llvm/llvm-project.gitcd llvm-projectgit checkout release/11.xmkdir ./buildcd ..mkdir llvm-project-tmpfssudo mount -t tmpfs -o size=10G,mode=1777 tmpfs ./llvm-project-tmpfscp -r llvm-project/* llvm-project-tmpfscd ./llvm-project-tmpfs/buildcmake -G Ninja \ -DLLVM_ENABLE_PROJECTS="clang;libcxx;libcxxabi;lldb;compiler-rt;lld" \ -DCMAKE_BUILD_TYPE=Release ../llvmtime cmake --build .We’re using the LLVM 11.0.0 release as the build target version, and we’re compiling Clang, libc++abi, LLDB, Compiler-RT and LLD using GCC 10.2 (self-compiled). To avoid any concerns about I/O we’re building things on a ramdisk – on a 4KB page system 5GB should be sufficient but on the Altra’s 64KB system it used up to 9.5GB, including the source directory. We’re measuring the actual build time and don’t include the configuration phase as usually in the real world that doesn’t happen repeatedly.
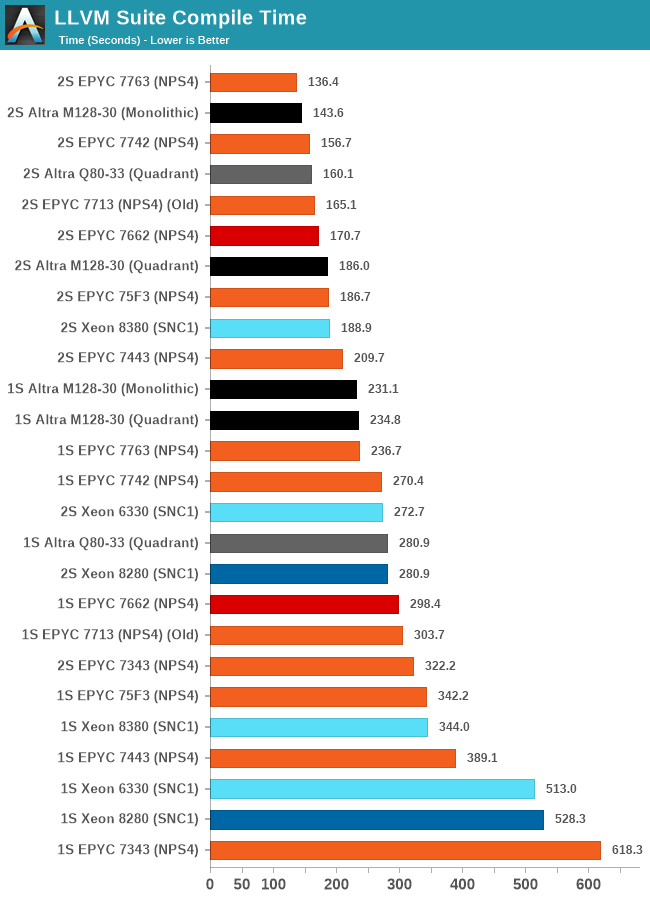
The LLVM compile test results here are quite more special and demand more attention that what meets the eye at first.
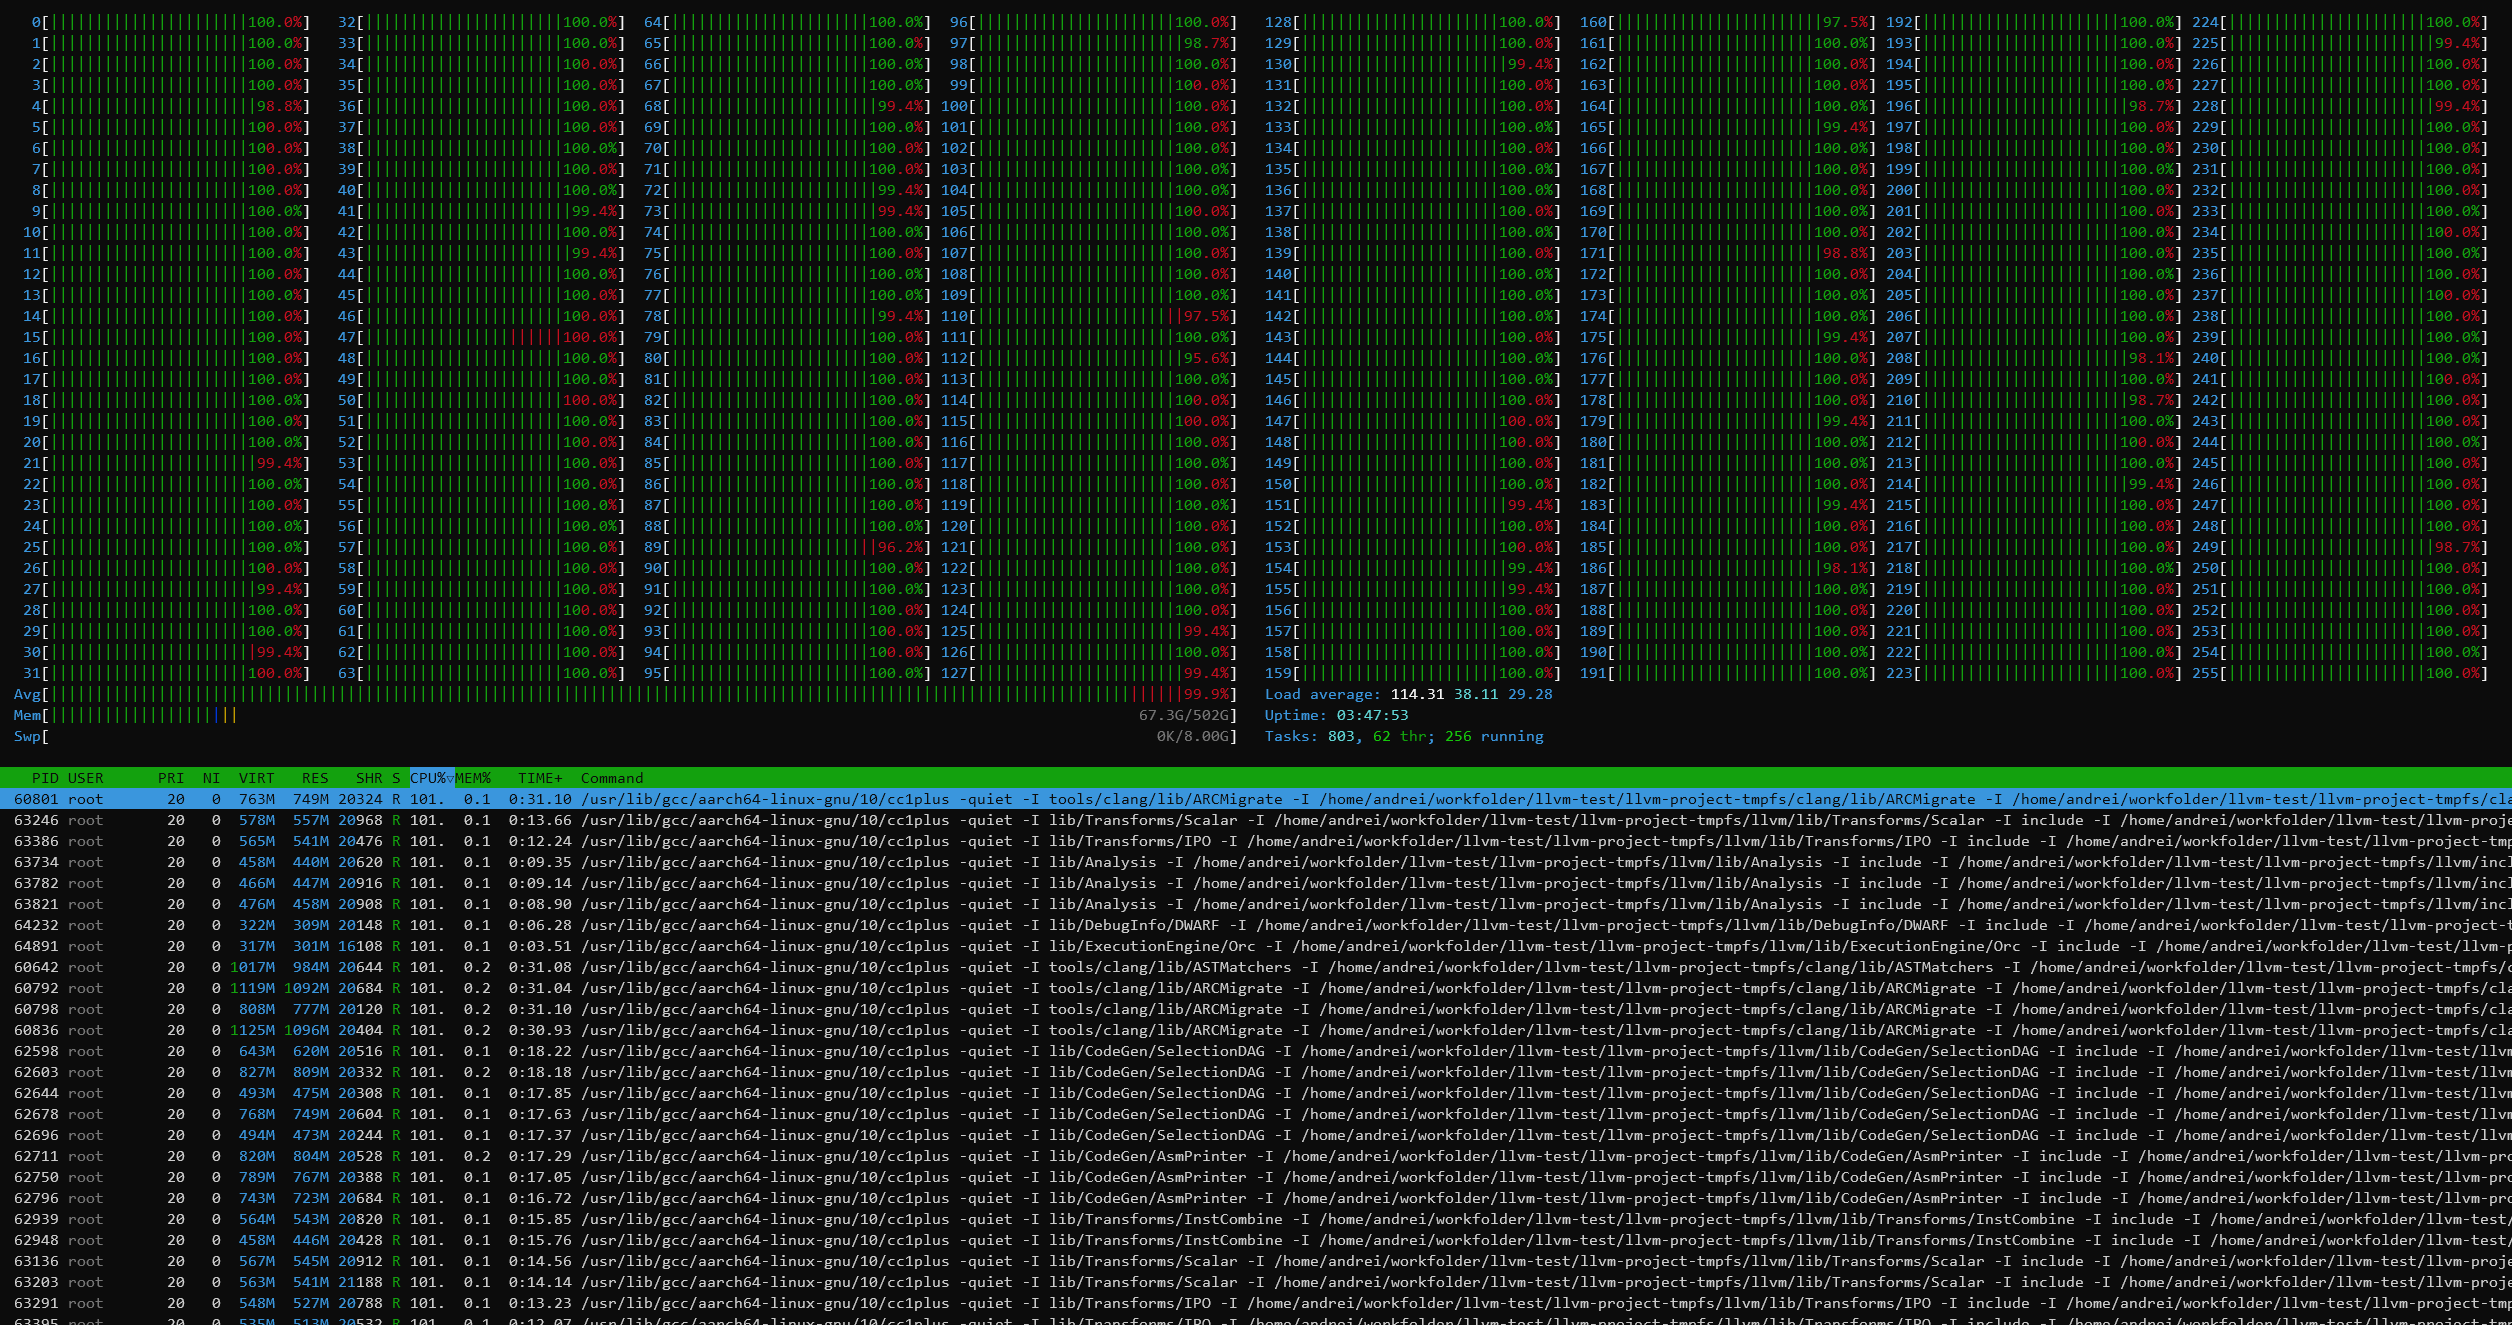
Inherently, the biggest work slice of the test is massively parallel, able to take advantage of all cores in a system, 256 cores in the 2-socket results of the M128-30, however as it’s also a real-world test, the compilation also incurs linking phases where the chip is inherently just under a single-core load and all other cores are just sitting idle.
This behaviour results in some more complex behaviour in the different test scenarios of the M128-30, as the ratio between the parallel/MT and ST phases of the test changes.
In the single-socket results, the chip showcases a +14% performance boost over the Q80-33, while in the 2S results under quadrant mode, this actually transforms into a 16% performance regression. What’s happening here is that while the increased core count of the chip massively helps in improving the actual compilation of objects, the linking phase of the test is significantly slower and takes up a larger percentage of total test time than on the Q80-33, due to the lower CPU frequencies and smaller SLC of the new chip.
Running the M128-30 in monolithic mode actually results in a 24% reduction in compile time, mostly through a large speedup of the linking phase of the compilation as we’re giving that one active core access to the whole 16MB SLC rather than just a 4MB slice.
AMD’s EPYC 7763, even though it has only half the core count, still manages to outperform the M128-30 in the total test time because the linking phase is much sped up thanks to the much superior single-threaded performance of the cores when few threads are active on the SoC. The 34% advantage of the ST SPEC scores here comes more into play than the MT throughput of the chip.
These results are very interesting, and showcase that even in a more real-world scenario like this, the flock-of-chickens approach doesn’t work out as well even in what would consider a massively parallel workload, as some things just cannot be spread out over multiple cores well. It reminds me very much of the eMAG chip, which also suffered in real world code compilations due to the very same reasons.


60 Comments
View All Comments
dullard - Thursday, October 7, 2021 - link
Far too many people mistakenly think it is AMD vs Intel. In reality it is ARM vs (AMD + Intel together).TheinsanegamerN - Thursday, October 7, 2021 - link
In reality it's AMD VS INTEL, with ARM the red headed stepchild with 3 extra chromosomes drooling in the corner. x86 still commands 99% of the server market.DougMcC - Thursday, October 7, 2021 - link
And the reason is price/performance. These chips are pricey for what they deliver, and it shows in amazon instance costs. We looked at moving to graviton 2 instances in aws and even with the in-house pricing advantage there we would be losing 55+% performance for <25% price advantage.eastcoast_pete - Thursday, October 7, 2021 - link
Was/is it really that bad? Wow! I thought AWS is making a value play for their gravitons, your example suggests that isn't working so great.mode_13h - Thursday, October 7, 2021 - link
Could be that demand is simply outstripping their supply. Amazon isn't immune from chip shortages either, you know?DougMcC - Thursday, October 7, 2021 - link
It was for us. Could be that there are workload issues specific to us, though as a pretty basic j2ee app it's somewhat hard for me to imagine that we are unique.lightningz71 - Friday, October 8, 2021 - link
It is VERY workload dependent.lemurbutton - Friday, October 8, 2021 - link
Graviton2 is now 50% of all new instances at AWS.DougMcC - Friday, October 8, 2021 - link
Not super surprising. Even with the massive loss of performance, it's still cheaper. If you don't need performance, why wouldn't you choose the cheapest thing?Wilco1 - Friday, October 8, 2021 - link
In most cases Graviton is not only cheaper but also significantly faster. It's easy to find various examples:https://docs.keydb.dev/blog/2020/03/02/blog-post/
https://about.gitlab.com/blog/2021/08/05/achieving...
https://yegorshytikov.medium.com/aws-graviton-2-ar...
https://www.instana.com/blog/best-practices-for-an...