ADATA External and HP Portable SSDs Review: Featuring the ADATA SE800 and HP P700
by Ganesh T S on September 24, 2020 8:00 AM ESTPCMark 10 Storage Bench - Real-World Access Traces
There are a number of storage benchmarks that can subject a device to artificial access traces by varying the mix of reads and writes, the access block sizes, and the queue depth / number of outstanding data requests. We saw results from two popular ones - ATTO, and CrystalDiskMark - in a previous section. More serious benchmarks, however, actually replicate access traces from real-world workloads to determine the suitability of a particular device for a particular workload. Real-world access traces may be used for simulating the behavior of computing activities that are limited by storage performance. Examples include booting an operating system or loading a particular game from the disk.
PCMark 10's storage bench (introduced in v2.1.2153) includes four storage benchmarks that use relevant real-world traces from popular applications and common tasks to fully test the performance of the latest modern drives:
- The Full System Drive Benchmark uses a wide-ranging set of real-world traces from popular applications and common tasks to fully test the performance of the fastest modern drives. It involves a total of 204 GB of write traffic.
- The Quick System Drive Benchmark is a shorter test with a smaller set of less demanding real-world traces. It subjects the device to 23 GB of writes.
- The Data Drive Benchmark is designed to test drives that are used for storing files rather than applications. These typically include NAS drives, USB sticks, memory cards, and other external storage devices. The device is subjected to 15 GB of writes.
- The Drive Performance Consistency Test is a long-running and extremely demanding test with a heavy, continuous load for expert users. In-depth reporting shows how the performance of the drive varies under different conditions. This writes more than 23 TB of data to the drive.
Despite the data drive benchmark appearing most suitable for testing direct-attached storage, we opted to run the full system drive benchmark as part of our evaluation flow. Many of us use portable flash drives as boot drives and storage for Steam games. These types of use-cases are addressed only in the full system drive benchmark.
The Full System Drive Benchmark comprises of 23 different traces. For the purpose of presenting results, we classify them under five different categories:
- Boot: Replay of storage access trace recorded while booting Windows 10
- Creative: Replay of storage access traces recorded during the start up and usage of Adobe applications such as Acrobat, After Effects, Illustrator, Premiere Pro, Lightroom, and Photoshop.
- Office: Replay of storage access traces recorded during the usage of Microsoft Office applications such as Excel and Powerpoint.
- Gaming: Replay of storage access traces recorded during the start up of games such as Battlefield V, Call of Duty Black Ops 4, and Overwatch.
- File Transfers: Replay of storage access traces (Write-Only, Read-Write, and Read-Only) recorded during the transfer of data such as ISOs and photographs.
PCMark 10 also generates an overall score, bandwidth, and average latency number for quick comparison of different drives. The sub-sections in the rest of the page refrence the access traces specified in the PCMark 10 Technical Guide.
Booting Windows 10
The read-write bandwidth recorded for each 1GBps-class drive in the boo access trace is presented below.
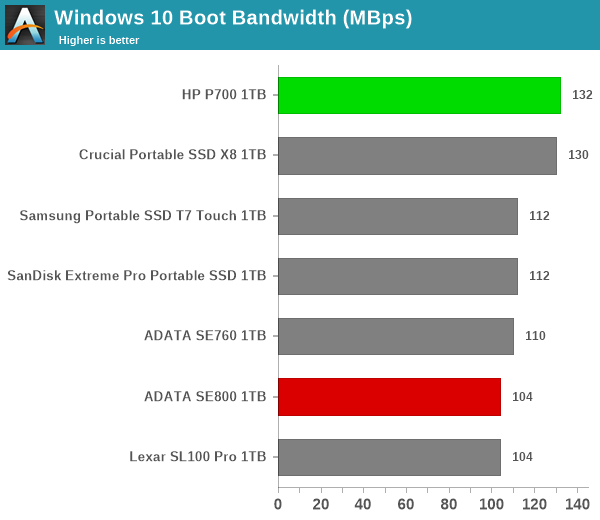
The HP P700 overtages the X8 by 2MBps, while the other drives including the two new ADATA ones are clustered between 104 MBps and 112 MBps. Given the amount of data traffic involved, the gulf is unlikely to result in a major difference in the boot times with various drives. The equivalent graph for the 500MBps-class drives is shown below.
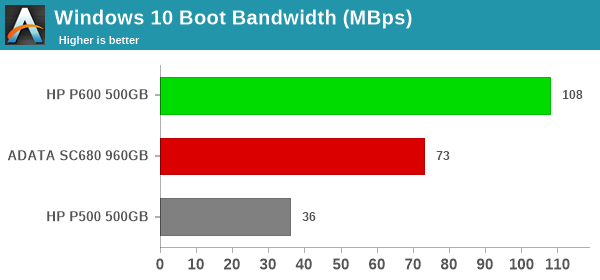
The HP P600 comes out miles ahead of the SC680, while the P500 cuts a sorry figure.
Creative Workloads
The read-write bandwidth recorded for each 1GBps-class drive in the sacr, saft, sill, spre, slig, sps, aft, exc, ill, ind, psh, and psl access traces are presented below.
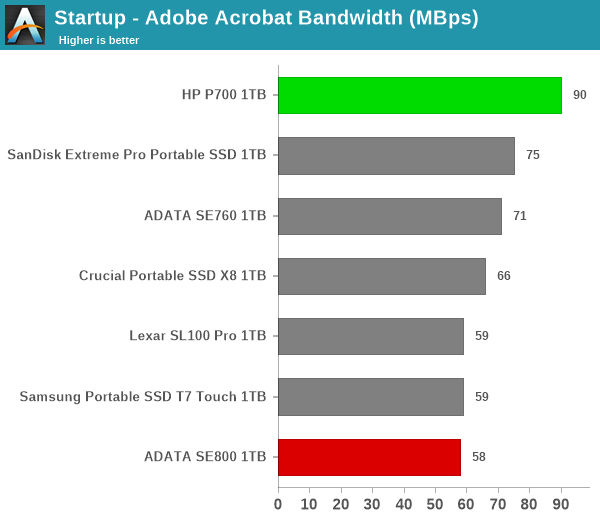
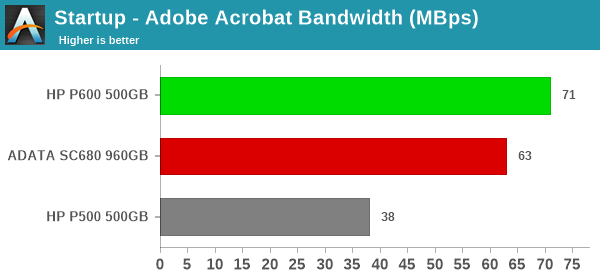
The HP Portable SSD P700 emerges as a top performer (sometimes by a significant margin) in almost all of the creative workloads. The case for the HP P600 is similar in the 500MBps-class drives set below.
Office Workloads
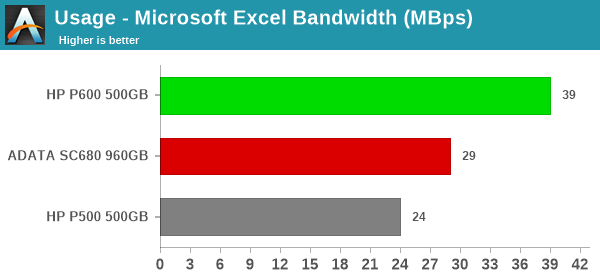
The read-write bandwidth recorded for each 1GBps-class drive in the exc and pow access traces are presented below.
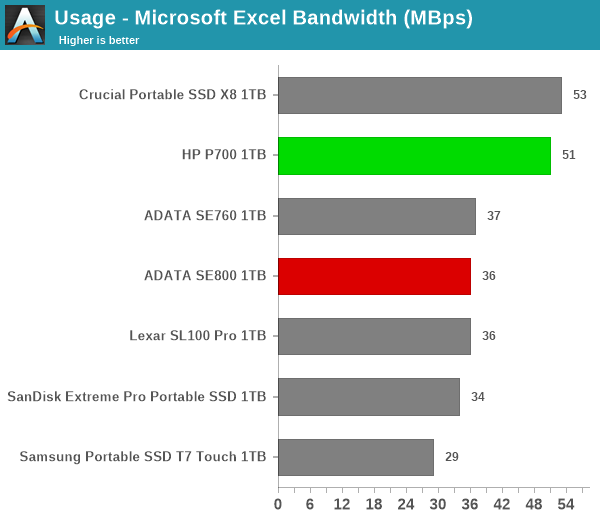
The HP P700 performs well in the office workloads too, though the lead is not quite as significant as what was seen in the previous workloads set. The HP P600 does perform signficantly better than the ADATA SC680 in the 500MBps-class, though.
Gaming Workloads
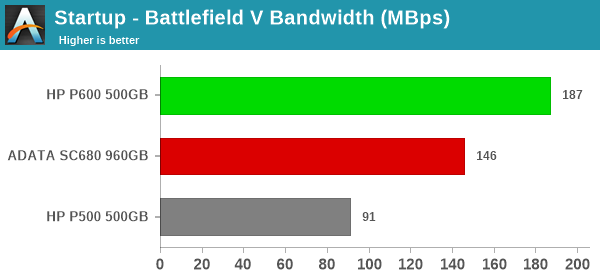
The read-write bandwidth recorded for each 1GBps-class drive in the bf, cod, and ow access traces are presented below.
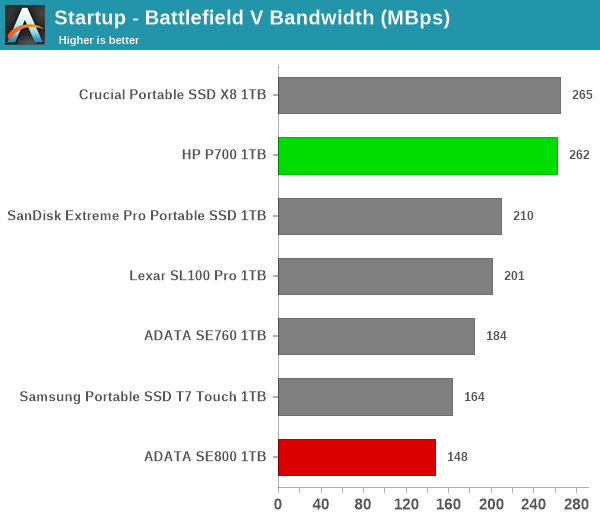
The Crucial X8 and HP P700 are neck-and-neck in the gaming workloads above, but the HP P600 emerges as the clear winner in the 500MBps-class.
Files Transfer Workloads
The read-write bandwidth recorded for each 1GBps-drive in the cp1, cp2, cp3, cps1, cps2, and cps3 access traces are presented below.
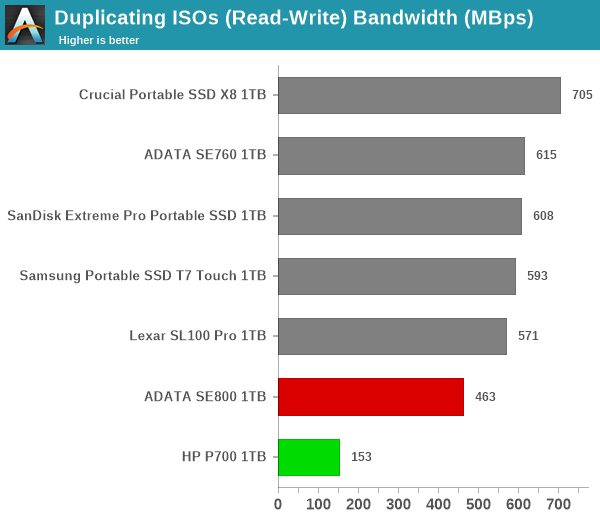
For pure reads or writes, the HP P700 performs well as seen in previous sections. However, once mixed traffic starts coming in, both the HP P700 and ADATA SE800 suffer, with the former being affected more. The ADATA SE760 performs much better with mixed traffic compared to the other two drives.
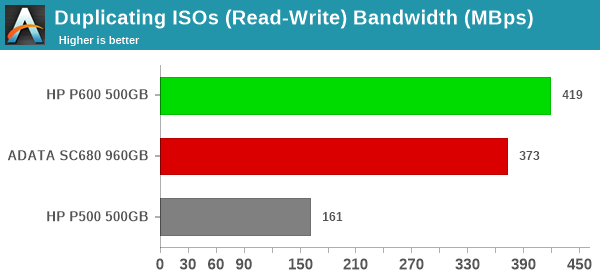
On the 500MBps-class front, we see that the ADATA SC680 putting up a much better challenge, and even performing better than the HP P600 in a few cases.
Overall Scores
PCMark 10 reports an overall score based on the observed bandwidth and access times for the full workload set. The score, bandwidth, and average access latency for each of the 1GBps-class drives are presented below.
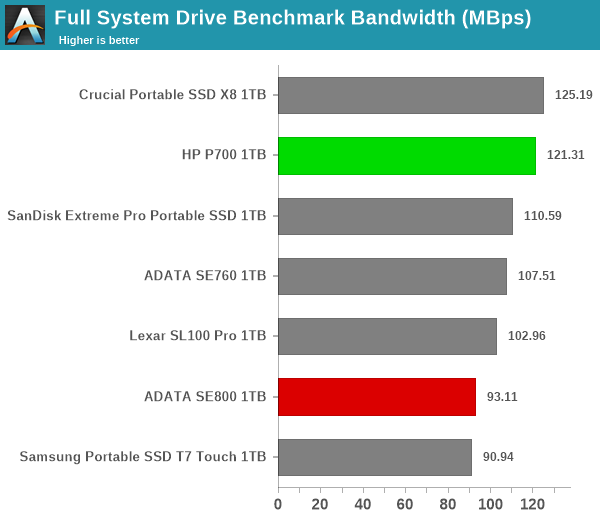
The Crucial X8 and the HP Portable SSD P700 perform quite similarly as far as the practical PCMark 10 workload traces are concerned.
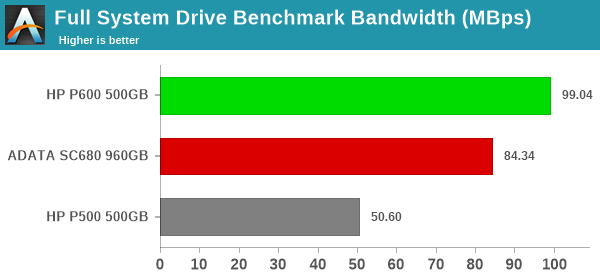
The HP Portable SSD P600 emerges as the best of the lot in the 500MBps-class set by a huge margin.


13 Comments
View All Comments
Dug - Friday, September 25, 2020 - link
The amount of thought that went into thermals is unbelievable. Especially when you take into account what was needed to create the internals.You can get a 1000hp motor but not the tranny or suspension to handle it.
Semenaxpills - Sunday, October 11, 2020 - link
There are a great deal of cancer prevention agents in this rundown, https://www.smore.com/fhr95-semenax-review-it-work... intended to zero in your outcomes on creating better quality and amount of discharge anyway a few fixings offer optional advantages, for example, improving the quality of your erection, giving you somewhat more energy, endurance or charisma.xtrazextest - Friday, October 23, 2020 - link
Xtrazex is a cutting edge item to improve intensity extensively. The proficiency and wellbeing of it were affirmed by specialized https://lasciencecoalition.org/de/xtrazex-erfahrun... testing and mysterious tests led among the clients of Xtrazex. Its brisk and powerful exhibition has been demonstrated to fortify, look after erections, and expanding the term of sexual intercourses. The very much picked arrangement of dynamic substances commonly helping out one another is answerable for the amazing impacts.