The AMD 3rd Gen Ryzen Deep Dive Review: 3700X and 3900X Raising The Bar
by Andrei Frumusanu & Gavin Bonshor on July 7, 2019 9:00 AM EST** = Old results marked were performed with the original BIOS & boost behaviour as published on 7/7.
Benchmarking Performance: CPU System Tests
Our System Test section focuses significantly on real-world testing, user experience, with a slight nod to throughput. In this section we cover application loading time, image processing, simple scientific physics, emulation, neural simulation, optimized compute, and 3D model development, with a combination of readily available and custom software. For some of these tests, the bigger suites such as PCMark do cover them (we publish those values in our office section), although multiple perspectives is always beneficial. In all our tests we will explain in-depth what is being tested, and how we are testing.
All of our benchmark results can also be found in our benchmark engine, Bench.
Application Load: GIMP 2.10.4
One of the most important aspects about user experience and workflow is how fast does a system respond. A good test of this is to see how long it takes for an application to load. Most applications these days, when on an SSD, load fairly instantly, however some office tools require asset pre-loading before being available. Most operating systems employ caching as well, so when certain software is loaded repeatedly (web browser, office tools), then can be initialized much quicker.
In our last suite, we tested how long it took to load a large PDF in Adobe Acrobat. Unfortunately this test was a nightmare to program for, and didn’t transfer over to Win10 RS3 easily. In the meantime we discovered an application that can automate this test, and we put it up against GIMP, a popular free open-source online photo editing tool, and the major alternative to Adobe Photoshop. We set it to load a large 50MB design template, and perform the load 10 times with 10 seconds in-between each. Due to caching, the first 3-5 results are often slower than the rest, and time to cache can be inconsistent, we take the average of the last five results to show CPU processing on cached loading.
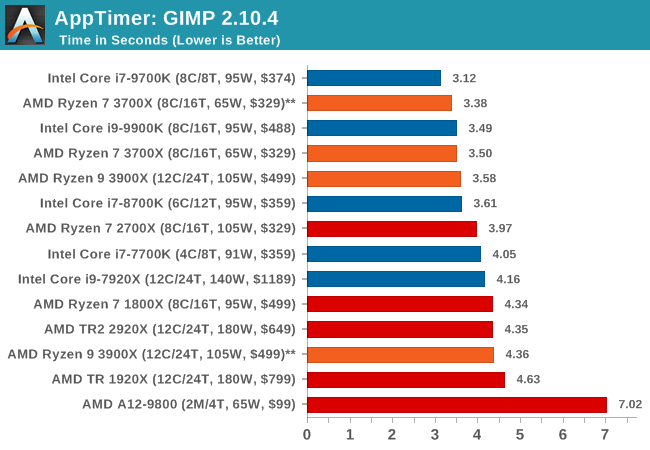
Application loading is typically single thread limited, but we see here that at some point it also becomes core-resource limited. Having access to more resources per thread in a non-HT environment helps the 8C/8T and 6C/6T processors get ahead of both of the 5.0 GHz parts in our testing.
3D Particle Movement v2.1: Brownian Motion
Our 3DPM test is a custom built benchmark designed to simulate six different particle movement algorithms of points in a 3D space. The algorithms were developed as part of my PhD., and while ultimately perform best on a GPU, provide a good idea on how instruction streams are interpreted by different microarchitectures.
A key part of the algorithms is the random number generation – we use relatively fast generation which ends up implementing dependency chains in the code. The upgrade over the naïve first version of this code solved for false sharing in the caches, a major bottleneck. We are also looking at AVX2 and AVX512 versions of this benchmark for future reviews.
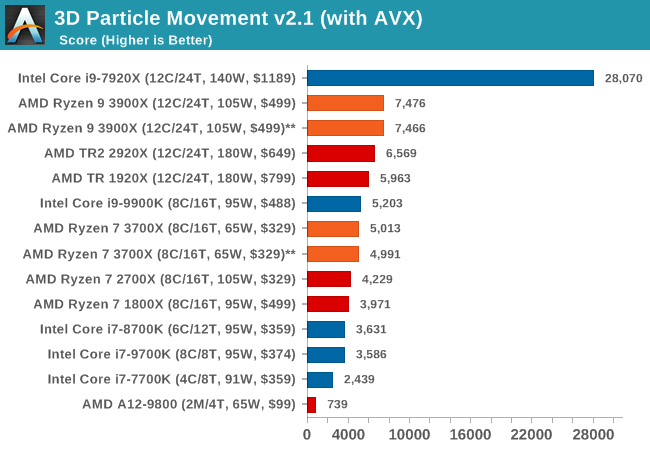
For this test, we run a stock particle set over the six algorithms for 20 seconds apiece, with 10 second pauses, and report the total rate of particle movement, in millions of operations (movements) per second. We have a non-AVX version and an AVX version, with the latter implementing AVX512 and AVX2 where possible.
3DPM v2.1 can be downloaded from our server: 3DPMv2.1.rar (13.0 MB)
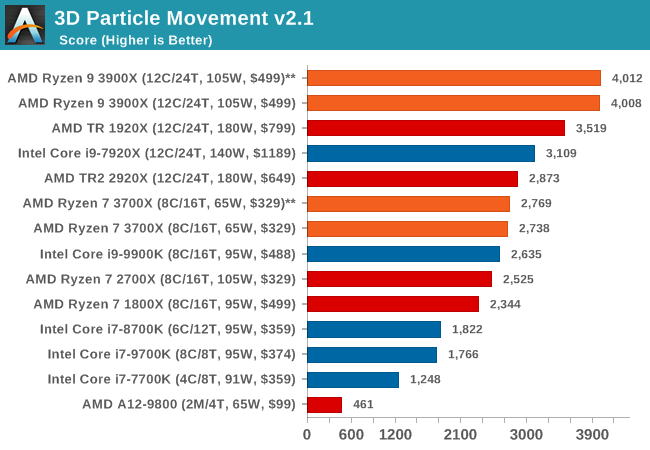
With a non-AVX code base, the 9900K shows the IPC and frequency improvements over the R7 2700X, although in reality it is not as big of a percentage jump as you might imagine. The processors without HT get pushed back a bit here.
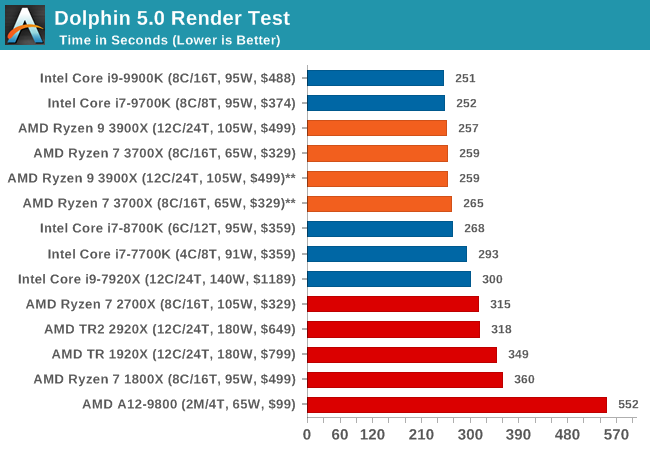
Dolphin 5.0: Console Emulation
One of the popular requested tests in our suite is to do with console emulation. Being able to pick up a game from an older system and run it as expected depends on the overhead of the emulator: it takes a significantly more powerful x86 system to be able to accurately emulate an older non-x86 console, especially if code for that console was made to abuse certain physical bugs in the hardware.
For our test, we use the popular Dolphin emulation software, and run a compute project through it to determine how close to a standard console system our processors can emulate. In this test, a Nintendo Wii would take around 1050 seconds.
The latest version of Dolphin can be downloaded from https://dolphin-emu.org/
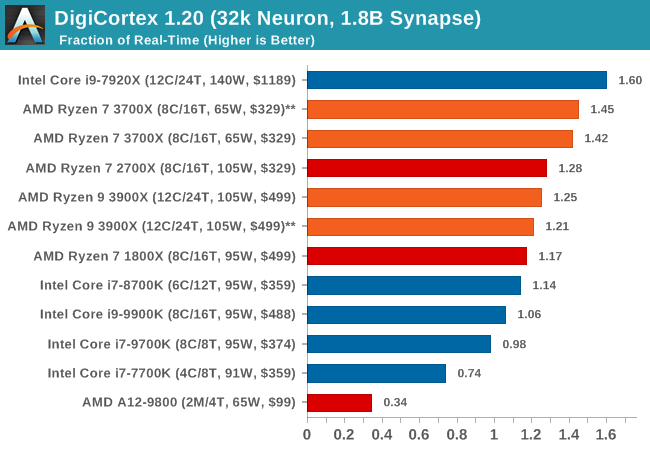
DigiCortex 1.20: Sea Slug Brain Simulation
This benchmark was originally designed for simulation and visualization of neuron and synapse activity, as is commonly found in the brain. The software comes with a variety of benchmark modes, and we take the small benchmark which runs a 32k neuron / 1.8B synapse simulation, equivalent to a Sea Slug.

Example of a 2.1B neuron simulation
We report the results as the ability to simulate the data as a fraction of real-time, so anything above a ‘one’ is suitable for real-time work. Out of the two modes, a ‘non-firing’ mode which is DRAM heavy and a ‘firing’ mode which has CPU work, we choose the latter. Despite this, the benchmark is still affected by DRAM speed a fair amount.
DigiCortex can be downloaded from http://www.digicortex.net/
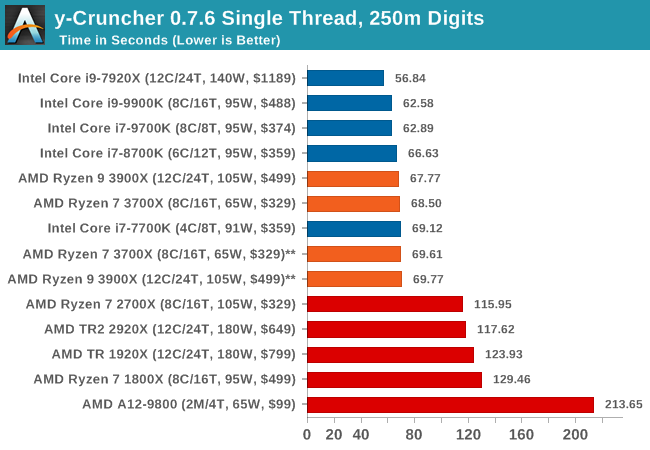
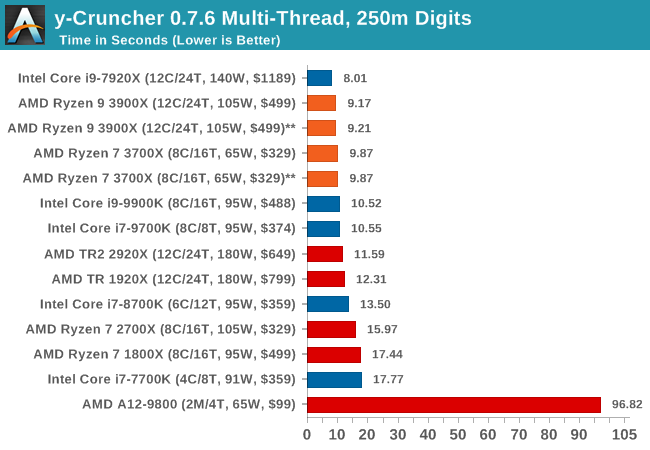
y-Cruncher v0.7.6: Microarchitecture Optimized Compute
I’ve known about y-Cruncher for a while, as a tool to help compute various mathematical constants, but it wasn’t until I began talking with its developer, Alex Yee, a researcher from NWU and now software optimization developer, that I realized that he has optimized the software like crazy to get the best performance. Naturally, any simulation that can take 20+ days can benefit from a 1% performance increase! Alex started y-cruncher as a high-school project, but it is now at a state where Alex is keeping it up to date to take advantage of the latest instruction sets before they are even made available in hardware.
For our test we run y-cruncher v0.7.6 through all the different optimized variants of the binary, single threaded and multi-threaded, including the AVX-512 optimized binaries. The test is to calculate 250m digits of Pi, and we use the single threaded and multi-threaded versions of this test.
Users can download y-cruncher from Alex’s website: http://www.numberworld.org/y-cruncher/
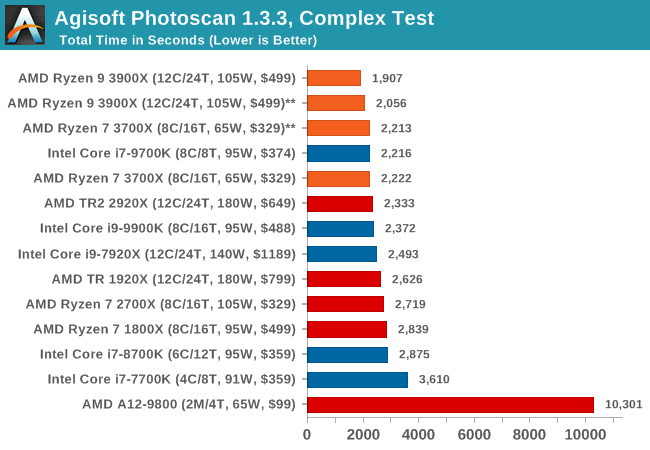
Agisoft Photoscan 1.3.3: 2D Image to 3D Model Conversion
One of the ISVs that we have worked with for a number of years is Agisoft, who develop software called PhotoScan that transforms a number of 2D images into a 3D model. This is an important tool in model development and archiving, and relies on a number of single threaded and multi-threaded algorithms to go from one side of the computation to the other.
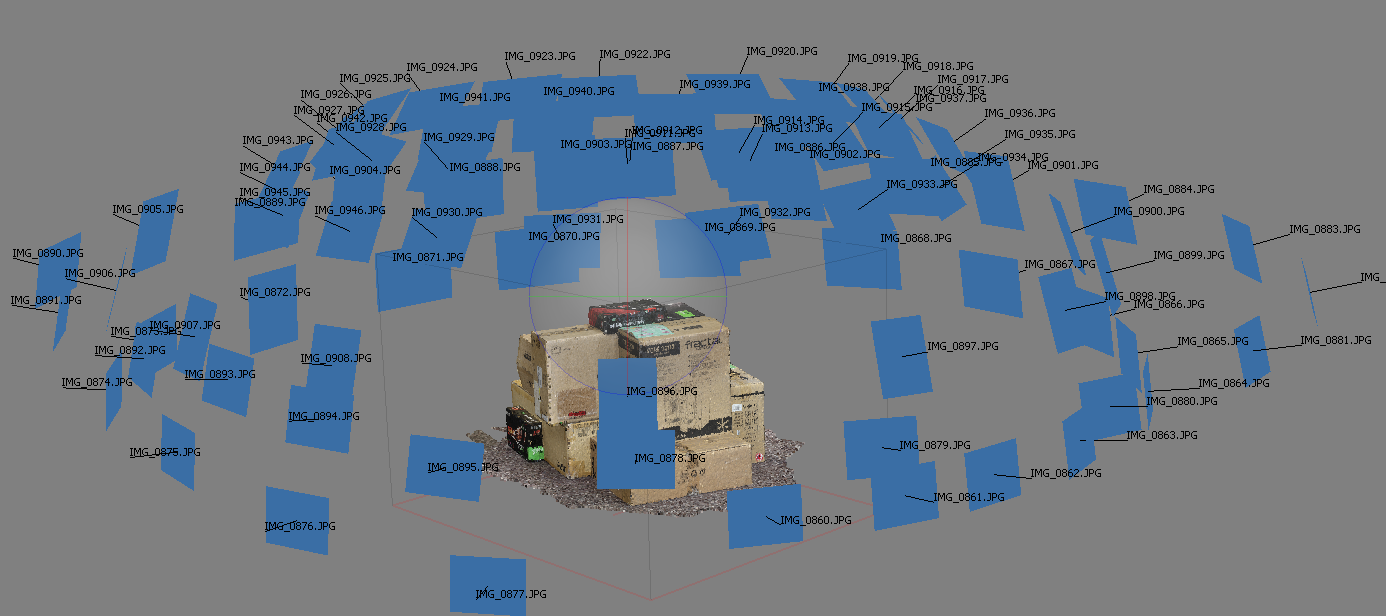
In our test, we use version 1.3.3 of the software with a good sized data set of 84 x 18 megapixel photos, and push it through a reasonably fast variant of the algorithms. We report the total time to complete the process.
Agisoft’s Photoscan website can be found here: http://www.agisoft.com/


447 Comments
View All Comments
Maxiking - Tuesday, July 23, 2019 - link
I said a few times... I don't tend to buy amd products so no, I am not gonna sue anybody.And as pointed out in the video, in his German one, he works for a retailer selling prebuilt pcs.. People keep returning pcs with AMD cpus becaue they do not boost to the promised frequency. You there, there are something like laws, if you write on the box 4.6ghz, it must reach it.
You are so knowledgeable, sharp minded and analytical when comes to meaning of words and what people want to say, you should sue Intel on your own, should be easy.
Atom2 - Monday, July 29, 2019 - link
ICC compiler is 3x faster than LLVM and AVX512 is 2x faster than AVX2. And both were left out of comparison? The comparison designed purely only for the LLVM compiler users? Used by who?Rudde - Saturday, August 10, 2019 - link
ICC is proprietary afaik and Anandtech prefers open compilers. AVX512 should be found in 3DPM and shows utter demolition by the only processor that supports it (7920X).MasterE - Wednesday, August 7, 2019 - link
I considered going with the Ryzen 9 3900X chip and an x570 motherboard for a new rendering system but since these chips aren't available for less than $820+ anywhere, I guess I'll be back to either the threadripper or Intel 9000+ series. There is simply no way I'm paying that kind of price for a chip with a Manufacters Suggested Retail Price of $499.gglaw - Friday, August 23, 2019 - link
@Andrei - I was just digging through reviews again before biting the bullet on a 3900X and one of the big questions that is not agreed upon in the tech community is gaming performance for PBO vs all-core overclock, yet you only run 2 benches on the overclocked settings. How can a review be complete with only 2 benches run, neither related to gaming? In a PURELY single threaded scenario PBO gives a tiny 2.X percent increase in single threaded Cinebench. This indicates to me that it is not sustaining the max 4.6 on a single core or it would have scaled better, so it may not be really comparing 4.6 vs 4.3 even for single threaded performance. Almost all recent game engines can at least utilize 4 threads, so I feel your exact same test run through the gaming suite would have shown a consistent winner with 4.3 all-core OC vs PBO. And in heavily threaded scenarios the gap would keep growing larger, but specifically in today's GAMES, especially if you consider very few of us have 0 background activity, all-core OC would hands-down win is my guess, but we could have better evidence of this if you could run a complete benchmarking suite. (unless I'm blind and missed it, in case my apologies :)I've been messing around with a 3700X, and even with a 14cm Noctua cooling it, it does not sustain max allowed boost on even a single core with PBO which is another thing I wish you touched on more. During your testing do you monitor the boost speeds and what percent of the time it can stay at the max boost over XX minutes?
Maxiking - Monday, August 26, 2019 - link
Veni, vidi viciYeah, I was right.
I would like to thank my family for all the support I have received whilst fighting amd fanboys.
It was difficult, sometimes I was seriously thinking about giving up but the truth can not be stopped!
The AMD fraud has been confirmed.
https://www.reddit.com/r/pcgaming/comments/cusn2t/...
Ninjawithagun - Thursday, October 10, 2019 - link
Now all you have to do is have all these benchmarks ran again after applying the 1.0.0.3. ABBA BIOS update ;-)quadibloc - Tuesday, November 12, 2019 - link
I am confused by the diagram of the current used by individual cores as the number of threads is increased. Since SMT doesn't double the performance of a core, on the 3900X, for example, shouldn't the number of cores in use increase to all 12 for the first 12 threads, one core for each thread, with all cores then remaining in use as the number of threads continues to increase to 24?Or is it just that this chart represents power consumption under a particular setting that minimizes the number of cores in use, and other settings that maximize performance are also possible?
SjLeonardo - Saturday, December 14, 2019 - link
Core and uncore get supplied by different VRMs, right?Parkab0y - Sunday, October 4, 2020 - link
I really want to see something like this about zen3 5000