The AMD 3rd Gen Ryzen Deep Dive Review: 3700X and 3900X Raising The Bar
by Andrei Frumusanu & Gavin Bonshor on July 7, 2019 9:00 AM EST** = Old results marked were performed with the original BIOS & boost behaviour as published on 7/7.
Power Consumption & Overclocking
Power consumption of the new Ryzen 3900X and 3700X are of particular interest because it’s a very key aspect of the new generation chipsets, and AMD promises some extremely large improvements thanks to the new 7nm process node as well as the optimised chiplet design.
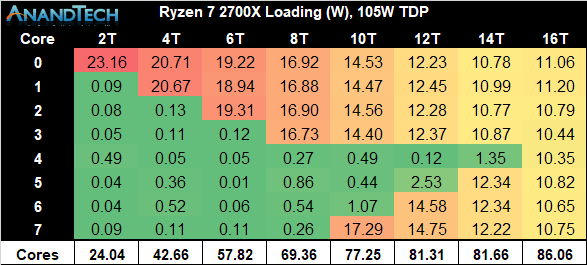
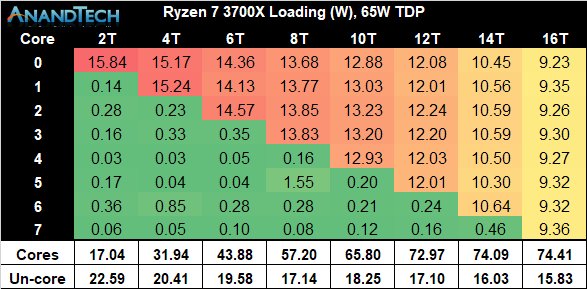
When comparing the single-chiplet Ryzen 3700X to the previous generation Ryzen 2700X, we’re seeing quite some dramatic differences in core power consumption. In particular power consumption at each chip’s respective peak frequency is notably different: Although the new 3700X has a 100MHz higher clock speed and thus is further up the exponential power curve, it manages to showcase 32% lower absolute power than the 2700X.
We have to remember that we’re talking about overall absolute power, and not efficiency of the chip. When taking actual performance into account through the higher clock as well as Zen2’s increased performance per clock, the Performance/W figures for the new 3700X should be significantly higher than its predecessor.
What is curious about the new chip is just how closely it follows its power limitations. The new boosting algorithm on the Ryzen 3 series is a particularly “opportunistic” one that will go as high in frequencies as it can go within its constraints, no matter the amount of CPU cores.
The constraints are as follows:
- Package Power Tracking (PPT): The power threshold that is allowed to be delivered to the socket.
- This is 88W for 65W TDP processors, and 142W for 105W TDP processors.
- Thermal Design Current (TDC): The maximum amount of current delivered by the motherboard’s voltage regulators when under thermally constrained scenarios (high temperatures)
- This is 60A for 65W TDP processors, and 95A for 105W TDP processors.
- Electrical Design Current (EDC): This is the maximum amount of current at any instantaneous short period of time that can be delivered by the motherboard’s voltage regulators.
- This is 90A for 65W TDP processors, and 140A for 105W TDP processors.
Looking at the total power consumption of the new 3700X, the chip is very much seemingly hitting and maintaining the 88W PPT limitations of the default settings, and we’re measuring 90W peak consumption across the package.
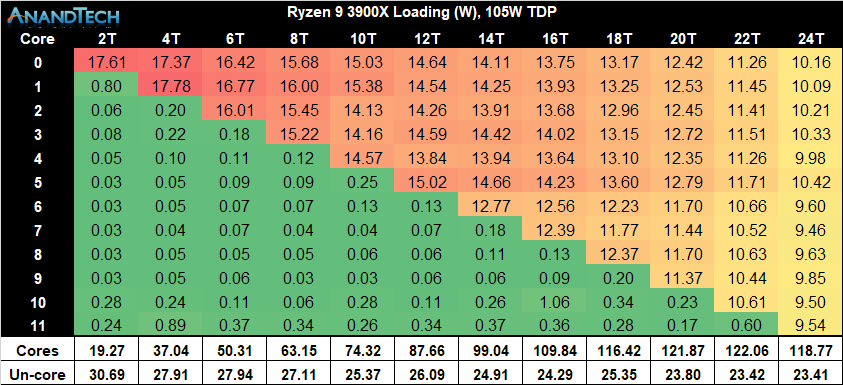
When having a closer look at the new Ryzen 9 3900X, first we have to enjoy the sheer amount of cores of this processor!
Following that, we see that this CPU’s per-core peak power consumption is quite notably higher than that of the 3700X, which is not a surprise given that the chip is clocked 200MHz higher at 4.6GHz versus “just” 4.4GHz. However even at this much higher clock, the 3900X’s power consumption remains notably lower than that of the 2700X.
Scaling up in threads as well as cores, we’re seeing a similar scaling behaviour, with the large difference being that the 3900X is maintaining higher power consumption per core (and frequency) than the 3700X. Fully loading the chip we’re seeing 118W power on the CPU cores while the package power is falling in at the exact 142W that AMD describes as the PPT limit of 105W TDP processors such as the 3900X.
Another thing to note in the results between the 3700X results and the 3900X, is that un-core power on the latter is quite higher. This really shouldn’t come as a surprise as the processor has a second chiplet who will have L3 and Infinity Fabric that will use more power.
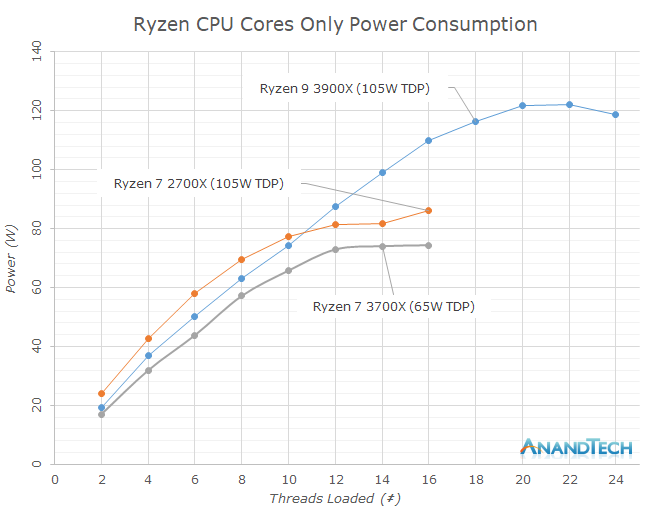
Graphing the three processors together, we see two main aspects: Again the 3900X and 3700X both consuming notably less power than the 2700X, and the 3700X’s hard limit when reaching the 88W PPT limit while the 3900X is able to scale further up till it hits the 142W limit.
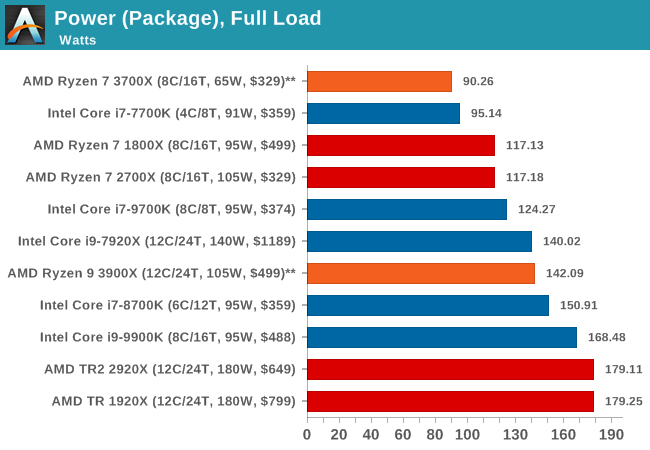
Comparing the full load power characteristics of both SKUs, they end up extremely competitive in both their respective categories. The 3700X’s 90W hard-limit puts it at the very bottom of the CPUs we’ve used in our testing today, which is quite astonishing as the chip is trading blows with the 9700K and 9900K across all of our test workloads, and the latter chip’s power consumption is well over 60% above the 3700X’s.
The 3900X is also impressive given that it’s a 12-core CPU. While posting substantial performance improvements of the 12-core Threadripper counterparts, the 3900X still manages to be significantly less thermally constrained thanks to its much lower power consumption, peaking in at 142W.
The most interesting aspect of AMD’s new opportunistic power boost mechanism lies in a CPU we weren’t able to test today: the Ryzen 7 3800X. At stock behaviour, the chip’s 105W TDP should allow it to behave a lot more like the 3900X when it comes to the higher thread-count frequencies, at least until it maxes out its 8 cores on its single chiplet, which might really put it ahead of the 3700X in terms of multi-threaded performance workloads.
Overclocking: PBO & All-Core
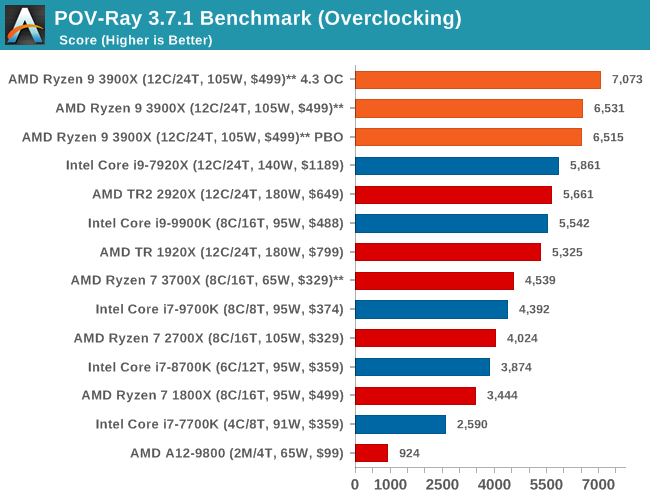
In POV-Ray, running the 3900X at a flat 4.3GHz at 1.35V gives it a 8.2% performance boost over stock. Enabling PBO doesn’t make much difference in multi-threaded workloads for the 3900X as it’s still being limited by the 142W PPT limit.
Unfortunately we weren’t able to further investigate raising the PPT limit for this article due to time contraints as well as currently non-final firmware version for X570 motherboards from the vendors.
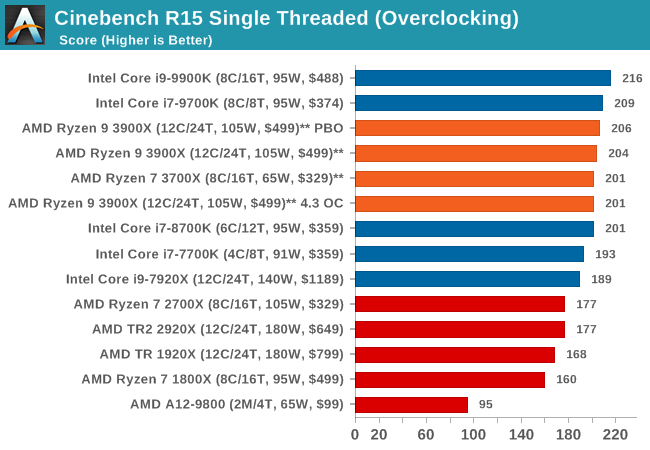
Turning on PBO will increase the single-threaded performance of the 3900X by a few percent, scoring just slightly higher than the stock settings. Naturally the 4.3 GHz flat overclock will regress in performance as it loses out 300MHz peak frequency compared to stock.
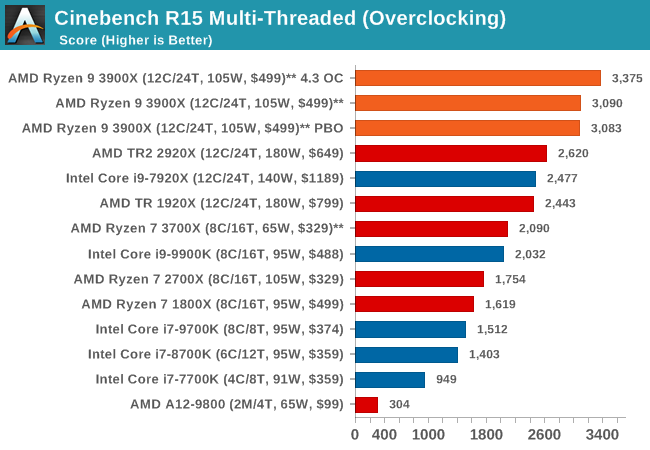
Finally, a Cinebench R15 MT run shows similar multi-threaded behaviour, with the 4.3GHz flat overclock achieving a 9.2% better score, whilst the PBO overclock isn’t able to further increase frequencies beyond the default power limits of the chip.


447 Comments
View All Comments
Maxiking - Tuesday, July 23, 2019 - link
I said a few times... I don't tend to buy amd products so no, I am not gonna sue anybody.And as pointed out in the video, in his German one, he works for a retailer selling prebuilt pcs.. People keep returning pcs with AMD cpus becaue they do not boost to the promised frequency. You there, there are something like laws, if you write on the box 4.6ghz, it must reach it.
You are so knowledgeable, sharp minded and analytical when comes to meaning of words and what people want to say, you should sue Intel on your own, should be easy.
Atom2 - Monday, July 29, 2019 - link
ICC compiler is 3x faster than LLVM and AVX512 is 2x faster than AVX2. And both were left out of comparison? The comparison designed purely only for the LLVM compiler users? Used by who?Rudde - Saturday, August 10, 2019 - link
ICC is proprietary afaik and Anandtech prefers open compilers. AVX512 should be found in 3DPM and shows utter demolition by the only processor that supports it (7920X).MasterE - Wednesday, August 7, 2019 - link
I considered going with the Ryzen 9 3900X chip and an x570 motherboard for a new rendering system but since these chips aren't available for less than $820+ anywhere, I guess I'll be back to either the threadripper or Intel 9000+ series. There is simply no way I'm paying that kind of price for a chip with a Manufacters Suggested Retail Price of $499.gglaw - Friday, August 23, 2019 - link
@Andrei - I was just digging through reviews again before biting the bullet on a 3900X and one of the big questions that is not agreed upon in the tech community is gaming performance for PBO vs all-core overclock, yet you only run 2 benches on the overclocked settings. How can a review be complete with only 2 benches run, neither related to gaming? In a PURELY single threaded scenario PBO gives a tiny 2.X percent increase in single threaded Cinebench. This indicates to me that it is not sustaining the max 4.6 on a single core or it would have scaled better, so it may not be really comparing 4.6 vs 4.3 even for single threaded performance. Almost all recent game engines can at least utilize 4 threads, so I feel your exact same test run through the gaming suite would have shown a consistent winner with 4.3 all-core OC vs PBO. And in heavily threaded scenarios the gap would keep growing larger, but specifically in today's GAMES, especially if you consider very few of us have 0 background activity, all-core OC would hands-down win is my guess, but we could have better evidence of this if you could run a complete benchmarking suite. (unless I'm blind and missed it, in case my apologies :)I've been messing around with a 3700X, and even with a 14cm Noctua cooling it, it does not sustain max allowed boost on even a single core with PBO which is another thing I wish you touched on more. During your testing do you monitor the boost speeds and what percent of the time it can stay at the max boost over XX minutes?
Maxiking - Monday, August 26, 2019 - link
Veni, vidi viciYeah, I was right.
I would like to thank my family for all the support I have received whilst fighting amd fanboys.
It was difficult, sometimes I was seriously thinking about giving up but the truth can not be stopped!
The AMD fraud has been confirmed.
https://www.reddit.com/r/pcgaming/comments/cusn2t/...
Ninjawithagun - Thursday, October 10, 2019 - link
Now all you have to do is have all these benchmarks ran again after applying the 1.0.0.3. ABBA BIOS update ;-)quadibloc - Tuesday, November 12, 2019 - link
I am confused by the diagram of the current used by individual cores as the number of threads is increased. Since SMT doesn't double the performance of a core, on the 3900X, for example, shouldn't the number of cores in use increase to all 12 for the first 12 threads, one core for each thread, with all cores then remaining in use as the number of threads continues to increase to 24?Or is it just that this chart represents power consumption under a particular setting that minimizes the number of cores in use, and other settings that maximize performance are also possible?
SjLeonardo - Saturday, December 14, 2019 - link
Core and uncore get supplied by different VRMs, right?Parkab0y - Sunday, October 4, 2020 - link
I really want to see something like this about zen3 5000