Kingston XS2000 Portable SSDs Review: USB 3.2 Gen 2x2 Goes Mainstream
by Ganesh T S on November 10, 2021 8:00 AM ESTPCMark 10 Storage Bench - Real-World Access Traces
There are a number of storage benchmarks that can subject a device to artificial access traces by varying the mix of reads and writes, the access block sizes, and the queue depth / number of outstanding data requests. We saw results from two popular ones - ATTO, and CrystalDiskMark - in a previous section. More serious benchmarks, however, actually replicate access traces from real-world workloads to determine the suitability of a particular device for a particular workload. Real-world access traces may be used for simulating the behavior of computing activities that are limited by storage performance. Examples include booting an operating system or loading a particular game from the disk.
PCMark 10's storage bench (introduced in v2.1.2153) includes four storage benchmarks that use relevant real-world traces from popular applications and common tasks to fully test the performance of the latest modern drives:
- The Full System Drive Benchmark uses a wide-ranging set of real-world traces from popular applications and common tasks to fully test the performance of the fastest modern drives. It involves a total of 204 GB of write traffic.
- The Quick System Drive Benchmark is a shorter test with a smaller set of less demanding real-world traces. It subjects the device to 23 GB of writes.
- The Data Drive Benchmark is designed to test drives that are used for storing files rather than applications. These typically include NAS drives, USB sticks, memory cards, and other external storage devices. The device is subjected to 15 GB of writes.
- The Drive Performance Consistency Test is a long-running and extremely demanding test with a heavy, continuous load for expert users. In-depth reporting shows how the performance of the drive varies under different conditions. This writes more than 23 TB of data to the drive.
Despite the data drive benchmark appearing most suitable for testing direct-attached storage, we opt to run the full system drive benchmark as part of our evaluation flow. Many of us use portable flash drives as boot drives and storage for Steam games. These types of use-cases are addressed only in the full system drive benchmark.
The Full System Drive Benchmark comprises of 23 different traces. For the purpose of presenting results, we classify them under five different categories:
- Boot: Replay of storage access trace recorded while booting Windows 10
- Creative: Replay of storage access traces recorded during the start up and usage of Adobe applications such as Acrobat, After Effects, Illustrator, Premiere Pro, Lightroom, and Photoshop.
- Office: Replay of storage access traces recorded during the usage of Microsoft Office applications such as Excel and Powerpoint.
- Gaming: Replay of storage access traces recorded during the start up of games such as Battlefield V, Call of Duty Black Ops 4, and Overwatch.
- File Transfers: Replay of storage access traces (Write-Only, Read-Write, and Read-Only) recorded during the transfer of data such as ISOs and photographs.
PCMark 10 also generates an overall score, bandwidth, and average latency number for quick comparison of different drives. The sub-sections in the rest of the page reference the access traces specified in the PCMark 10 Technical Guide.
Booting Windows 10
The read-write bandwidth recorded for each drive in the boo access trace is presented below.
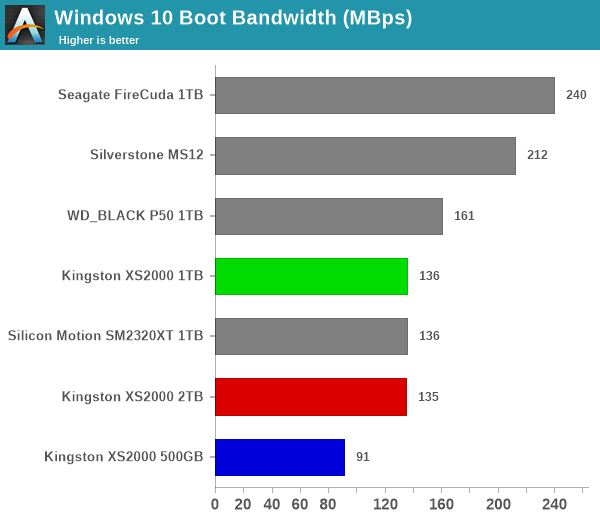
Portable SSDs sporting DRAM-equipped internal storage perform better for OS boot purposes. We see the top two capacities of the XS2000 perform reasonably well, but the 500GB SKU ends up with performance similar to that of SATA SSDs.
Creative Workloads
The read-write bandwidth recorded for each drive in the sacr, saft, sill, spre, slig, sps, aft, exc, ill, ind, psh, and psl access traces are presented below.
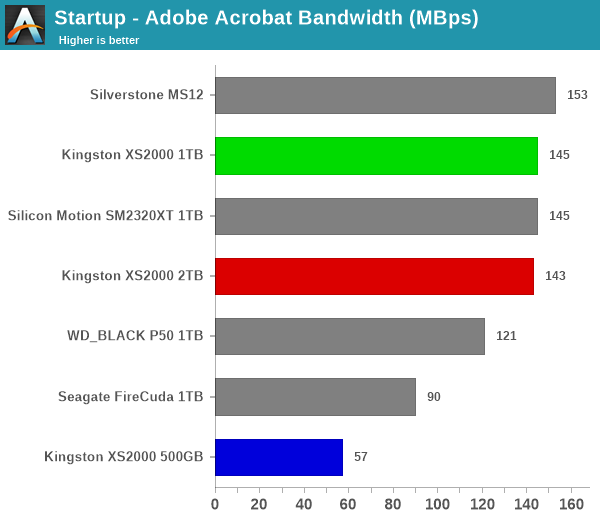
The 1TB and 2TB SKUs perform fairly similarly across almost all of the creative workloads. Similar to the boot workload, portable drives with DRAM-equipped SSDs manage better performance. The 500GB version is a laggard across all of the traces.
Office Workloads
The read-write bandwidth recorded for each drive in the exc and pow access traces are presented below.
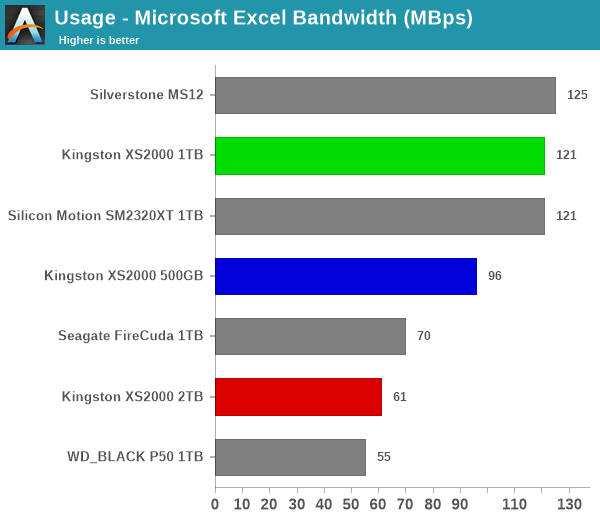
The office workloads see the 1TB version performing admirably in both traces. The 2TB version slips up in the spreadsheet workload, but performs as good as genuine NVMe SSDs in a bridge-based solution for the presentation one.
Gaming Workloads
The read-write bandwidth recorded for each drive in the bf, cod, and ow access traces are presented below.
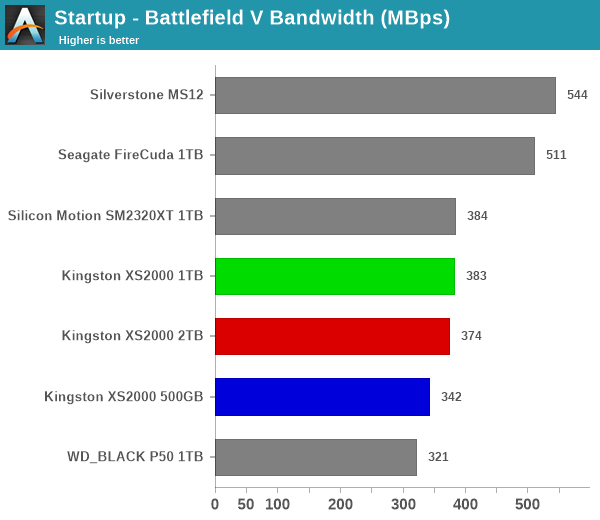
Read-heavy workloads are a forte of the XS2000, and we see the three SKUs perform quite well, landing in the middle of the pack.
Files Transfer Workloads
The read-write bandwidth recorded for each drive in the cp1, cp2, cp3, cps1, cps2, and cps3 access traces are presented below.
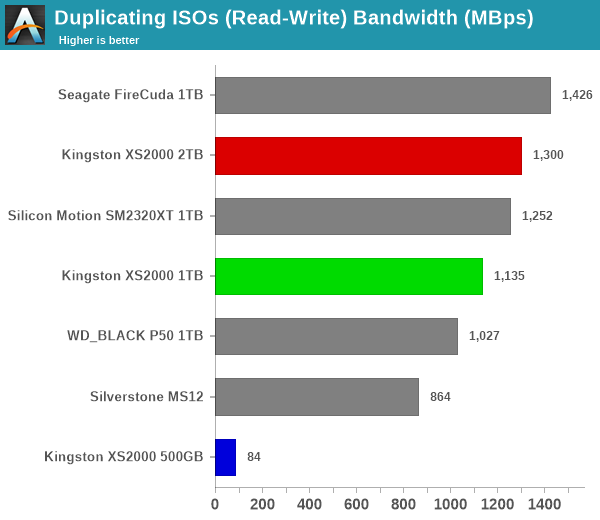
Read-only traces see the XS2000 SKUs land in the middle of the pack, similar to what was observed for the gaming workloads. When writes come into the picture, the heavy preconditioning lands the SKUs in hot water, with only the 2TB SKU coming out unscathed (thanks to its large SLC cache).
Overall Scores
PCMark 10 reports an overall score based on the observed bandwidth and access times for the full workload set. The score, bandwidth, and average access latency for each of the drives are presented below.
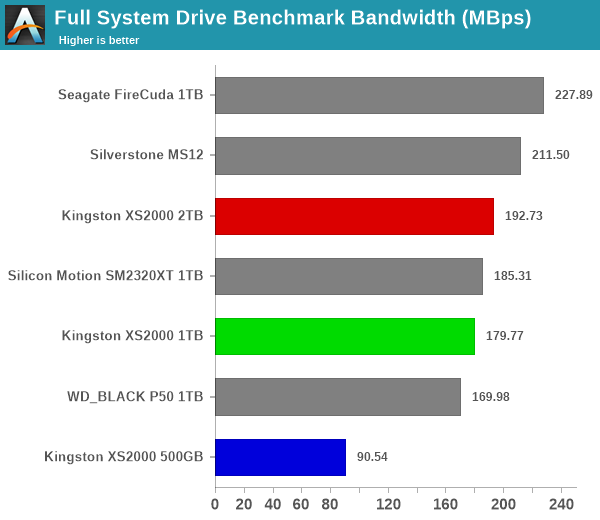
Overall, we see the SX2000 2TB SKU perform admirably, landing in the top half of the pack. However, the 500GB SKU suffers heavily - the bandwidth is half, and the latency double of what consumers have been expecting from 2GBps-class portable SSDs.


19 Comments
View All Comments
citan x - Wednesday, November 10, 2021 - link
SSD drives are so disappointing. I see these drives with huge numbers and I go buy one thinking that I won't have to wait for files to transfer and then I copy over files and I still get transfer times of minutes even if I only have to transfer a few gigabytes of files.The only storage product that I think can be better is the intel optane, but the price on those is ridiculous so I will probably never find out if it is really better or not.
meacupla - Wednesday, November 10, 2021 - link
are you transferring files through USB 2.0 or something?shabby - Wednesday, November 10, 2021 - link
He's copying files to an old school spinning hd.at_clucks - Thursday, November 11, 2021 - link
Throw a lot of small files at them and you slash an order or two of magnitude of performance from even the best of SSDs. Otherwise yes, the chain is only as fast as the slowest link.dontlistentome - Wednesday, November 10, 2021 - link
You're holding it wrong. I get best part of a gigabyte a second on mine. You need a fast drive to feed it with, and it will still be slow with small files, especially if you've not enabled caching in device manager.Tomatotech - Wednesday, November 10, 2021 - link
He's feeding it from a SSD!(A 64GB PATA 1.8" SSD from 2008. Not even SATA. They were in the 1st gen MacBook Airs - I replaced a couple.)
easp - Wednesday, November 10, 2021 - link
I have one sitting on a shelf next to me right now. I'm not sure why I haven't recycled it...Slash3 - Friday, November 12, 2021 - link
Slap it in an original iPod.Stan11003 - Wednesday, November 10, 2021 - link
You are missing something. Your experience with SSDs is vastly different than everyone.gfody - Wednesday, November 10, 2021 - link
the capacities are disappointing, you can make your own 8TB using an enclosure w/an asm2364 chip