Intel 11th Generation Core Tiger Lake-H Performance Review: Fast and Power Hungry
by Brett Howse & Andrei Frumusanu on May 17, 2021 9:00 AM EST- Posted in
- CPUs
- Intel
- 10nm
- Willow Cove
- SuperFin
- 11th Gen
- Tiger Lake-H
CPU Tests: Simulation
Simulation and Science have a lot of overlap in the benchmarking world, however for this distinction we’re separating into two segments mostly based on the utility of the resulting data. The benchmarks that fall under Science have a distinct use for the data they output – in our Simulation section, these act more like synthetics but at some level are still trying to simulate a given environment.
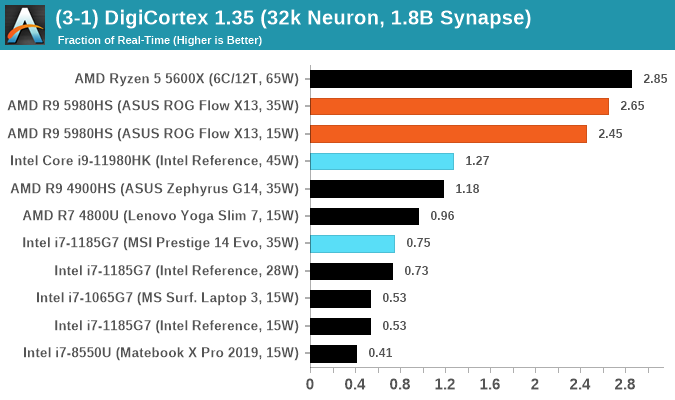
DigiCortex v1.35: link
DigiCortex is a pet project for the visualization of neuron and synapse activity in the brain. The software comes with a variety of benchmark modes, and we take the small benchmark which runs a 32k neuron/1.8B synapse simulation, similar to a small slug.
The results on the output are given as a fraction of whether the system can simulate in real-time, so anything above a value of one is suitable for real-time work. The benchmark offers a 'no firing synapse' mode, which in essence detects DRAM and bus speed, however we take the firing mode which adds CPU work with every firing.

The software originally shipped with a benchmark that recorded the first few cycles and output a result. So while fast multi-threaded processors this made the benchmark last less than a few seconds, slow dual-core processors could be running for almost an hour. There is also the issue of DigiCortex starting with a base neuron/synapse map in ‘off mode’, giving a high result in the first few cycles as none of the nodes are currently active. We found that the performance settles down into a steady state after a while (when the model is actively in use), so we asked the author to allow for a ‘warm-up’ phase and for the benchmark to be the average over a second sample time.
For our test, we give the benchmark 20000 cycles to warm up and then take the data over the next 10000 cycles seconds for the test – on a modern processor this takes 30 seconds and 150 seconds respectively. This is then repeated a minimum of 10 times, with the first three results rejected. Results are shown as a multiple of real-time calculation.
Dwarf Fortress 0.44.12: Link
Another long standing request for our benchmark suite has been Dwarf Fortress, a popular management/roguelike indie video game, first launched in 2006 and still being regularly updated today, aiming for a Steam launch sometime in the future.
Emulating the ASCII interfaces of old, this title is a rather complex beast, which can generate environments subject to millennia of rule, famous faces, peasants, and key historical figures and events. The further you get into the game, depending on the size of the world, the slower it becomes as it has to simulate more famous people, more world events, and the natural way that humanoid creatures take over an environment. Like some kind of virus.
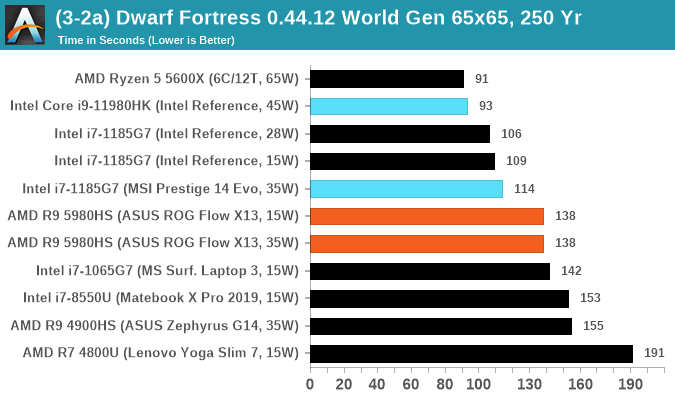
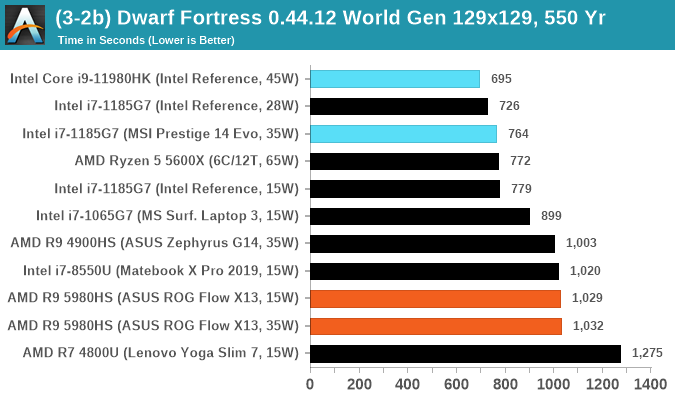
For our test we’re using DFMark. DFMark is a benchmark built by vorsgren on the Bay12Forums that gives two different modes built on DFHack: world generation and embark. These tests can be configured, but range anywhere from 3 minutes to several hours. After analyzing the test, we ended up going for three different world generation sizes:
- Small, a 65x65 world with 250 years, 10 civilizations and 4 megabeasts
- Medium, a 127x127 world with 550 years, 10 civilizations and 4 megabeasts
- Large, a 257x257 world with 550 years, 40 civilizations and 10 megabeasts
DFMark outputs the time to run any given test, so this is what we use for the output. We loop the small test for as many times possible in 10 minutes, the medium test for as many times in 30 minutes, and the large test for as many times in an hour.
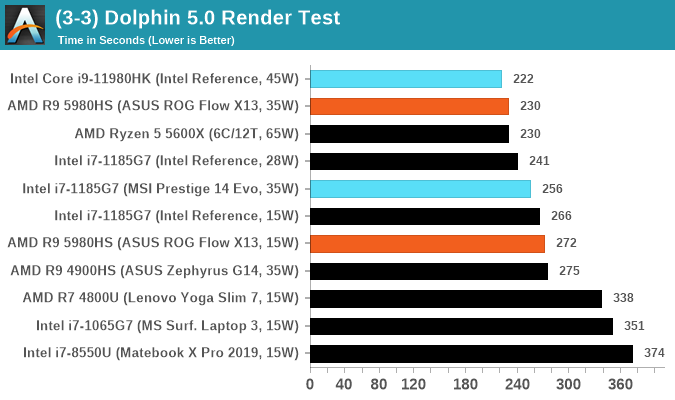
Dolphin v5.0 Emulation: Link
Many emulators are often bound by single thread CPU performance, and general reports tended to suggest that Haswell provided a significant boost to emulator performance. This benchmark runs a Wii program that ray traces a complex 3D scene inside the Dolphin Wii emulator. Performance on this benchmark is a good proxy of the speed of Dolphin CPU emulation, which is an intensive single core task using most aspects of a CPU. Results are given in seconds, where the Wii itself scores 1051 seconds.


229 Comments
View All Comments
Andrei Frumusanu - Monday, May 17, 2021 - link
As a note, we're just finishing up this review at the very last minute due to us getting our hands on the reference laptop only in the last 48h. I'll be completing the missing page texts in the next few hours as we're tidying up the article.EliteRetard - Monday, May 17, 2021 - link
Did you have a description/specs of the test systems?If it was there I missed it, even after going back to look.
Differences in RAM / storage etc. can affect some tests.
I'm guessing the size based on the name of the Asus...
Looks like you're comparing a 16" workstation vs a 13" thin/light?
Would the AMD CPU perform better in a larger/cooler chassis?
timecop1818 - Tuesday, May 18, 2021 - link
> Would the AMD CPU perform betterlol
Spunjji - Tuesday, May 18, 2021 - link
> timecop1818lol
Qasar - Tuesday, May 18, 2021 - link
gotta love timecrap181...at_clucks - Wednesday, May 19, 2021 - link
Come on, the Intel CPU actually performs decently... for a slowish desktop CPU stuck in a laptop chassis. Still not that bad.Spunjji - Thursday, May 20, 2021 - link
It performs very well, but timcarp1488 was completely misreading what had actually been said just to shitpost his usual anti-AMD nonsense.Spunjji - Tuesday, May 18, 2021 - link
"Did you have a description/specs of the test systems?"A brief description of the Intel reference system is in this review, more detail of the AMD system is available in the review these test results came from.
"Would the AMD CPU perform better in a larger/cooler chassis?"
A 45W variant of the AMD CPU in a larger chassis would see higher sustained multi-core performance, but single-core is probably quite similar.
Gondalf - Wednesday, May 19, 2021 - link
Strange article Andrei.5980HS is rated 35-54 W or 45W+. How can you judge that 45W Intel is less efficient?? Have you data about TDP settings of Asus X13 ? Likely the AMD SKU run at the highest TDP for more performance on Asus device, for several minutes or continuously.
Bet you neeed to be more informed in your articles, OEMs can go at the max TDP of a cpu since the Tskin of the laptop allow this.
Bet Intel Tiger Lake H will be faster than in your article on the right chassis ?
Bet direct power measures are better than generic comments ?
Retycint - Thursday, May 20, 2021 - link
Strange comment Gondalf.The graph of the 5980HS on page 2 shows that the Asus X13 runs at 42W for about 300s and then drops to 35W for the rest of the time.
Bet you didn't read the article and just came down instantly to try and feel smug?
Bet you need to be more informed when making hate posts?