Intel 11th Generation Core Tiger Lake-H Performance Review: Fast and Power Hungry
by Brett Howse & Andrei Frumusanu on May 17, 2021 9:00 AM EST- Posted in
- CPUs
- Intel
- 10nm
- Willow Cove
- SuperFin
- 11th Gen
- Tiger Lake-H
CPU Tests: Rendering
Rendering tests, compared to others, are often a little more simple to digest and automate. All the tests put out some sort of score or time, usually in an obtainable way that makes it fairly easy to extract. These tests are some of the most strenuous in our list, due to the highly threaded nature of rendering and ray-tracing, and can draw a lot of power. If a system is not properly configured to deal with the thermal requirements of the processor, the rendering benchmarks is where it would show most easily as the frequency drops over a sustained period of time. Most benchmarks in this case are re-run several times, and the key to this is having an appropriate idle/wait time between benchmarks to allow for temperatures to normalize from the last test.
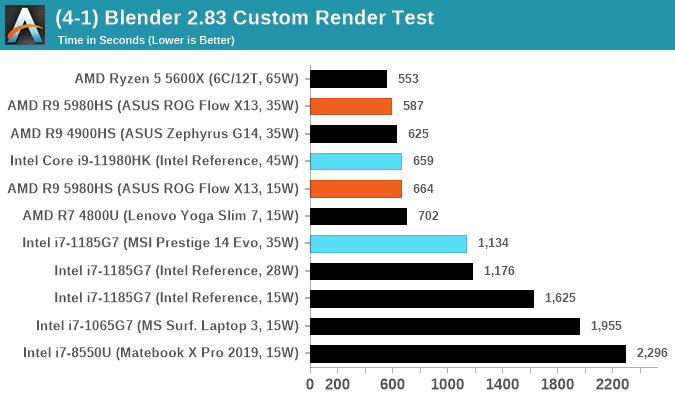
Blender 2.83 LTS: Link
One of the popular tools for rendering is Blender, with it being a public open source project that anyone in the animation industry can get involved in. This extends to conferences, use in films and VR, with a dedicated Blender Institute, and everything you might expect from a professional software package (except perhaps a professional grade support package). With it being open-source, studios can customize it in as many ways as they need to get the results they require. It ends up being a big optimization target for both Intel and AMD in this regard.
For benchmarking purposes, we fell back to one rendering a frame from a detailed project. Most reviews, as we have done in the past, focus on one of the classic Blender renders, known as BMW_27. It can take anywhere from a few minutes to almost an hour on a regular system. However now that Blender has moved onto a Long Term Support model (LTS) with the latest 2.83 release, we decided to go for something different.

We use this scene, called PartyTug at 6AM by Ian Hubert, which is the official image of Blender 2.83. It is 44.3 MB in size, and uses some of the more modern compute properties of Blender. As it is more complex than the BMW scene, but uses different aspects of the compute model, time to process is roughly similar to before. We loop the scene for at least 10 minutes, taking the average time of the completions taken. Blender offers a command-line tool for batch commands, and we redirect the output into a text file.
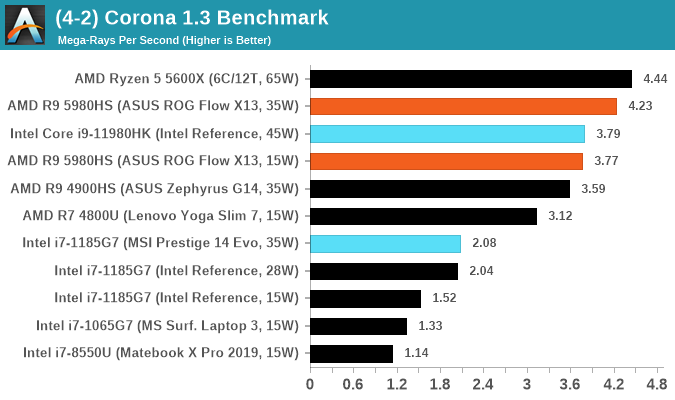
Corona 1.3: Link
Corona is billed as a popular high-performance photorealistic rendering engine for 3ds Max, with development for Cinema 4D support as well. In order to promote the software, the developers produced a downloadable benchmark on the 1.3 version of the software, with a ray-traced scene involving a military vehicle and a lot of foliage. The software does multiple passes, calculating the scene, geometry, preconditioning and rendering, with performance measured in the time to finish the benchmark (the official metric used on their website) or in rays per second (the metric we use to offer a more linear scale).

The standard benchmark provided by Corona is interface driven: the scene is calculated and displayed in front of the user, with the ability to upload the result to their online database. We got in contact with the developers, who provided us with a non-interface version that allowed for command-line entry and retrieval of the results very easily. We loop around the benchmark five times, waiting 60 seconds between each, and taking an overall average. The time to run this benchmark can be around 10 minutes on a Core i9, up to over an hour on a quad-core 2014 AMD processor or dual-core Pentium.
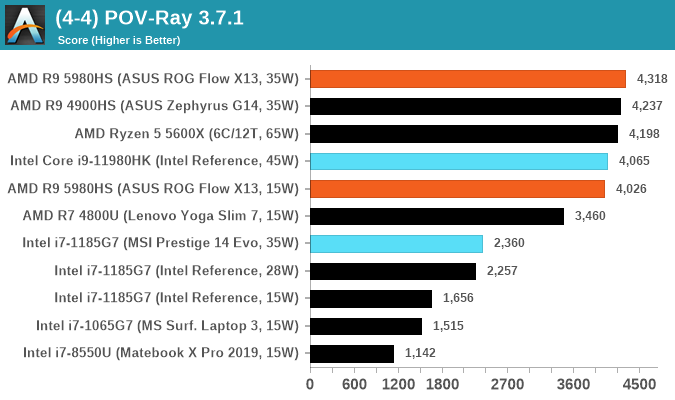
POV-Ray 3.7.1: Link
A long time benchmark staple, POV-Ray is another rendering program that is well known to load up every single thread in a system, regardless of cache and memory levels. After a long period of POV-Ray 3.7 being the latest official release, when AMD launched Ryzen the POV-Ray codebase suddenly saw a range of activity from both AMD and Intel, knowing that the software (with the built-in benchmark) would be an optimization tool for the hardware.
We had to stick a flag in the sand when it came to selecting the version that was fair to both AMD and Intel, and still relevant to end-users. Version 3.7.1 fixes a significant bug in the early 2017 code that was advised against in both Intel and AMD manuals regarding to write-after-read, leading to a nice performance boost.

The benchmark can take over 20 minutes on a slow system with few cores, or around a minute or two on a fast system, or seconds with a dual high-core count EPYC. Because POV-Ray draws a large amount of power and current, it is important to make sure the cooling is sufficient here and the system stays in its high-power state. Using a motherboard with a poor power-delivery and low airflow could create an issue that won’t be obvious in some CPU positioning if the power limit only causes a 100 MHz drop as it changes P-states.
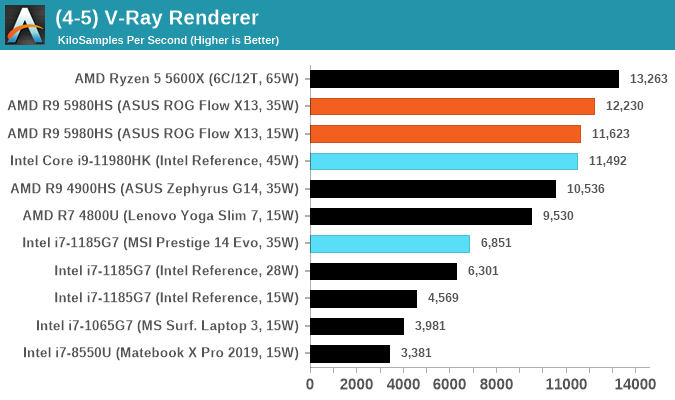
V-Ray: Link
We have a couple of renderers and ray tracers in our suite already, however V-Ray’s benchmark came through for a requested benchmark enough for us to roll it into our suite. Built by ChaosGroup, V-Ray is a 3D rendering package compatible with a number of popular commercial imaging applications, such as 3ds Max, Maya, Undreal, Cinema 4D, and Blender.
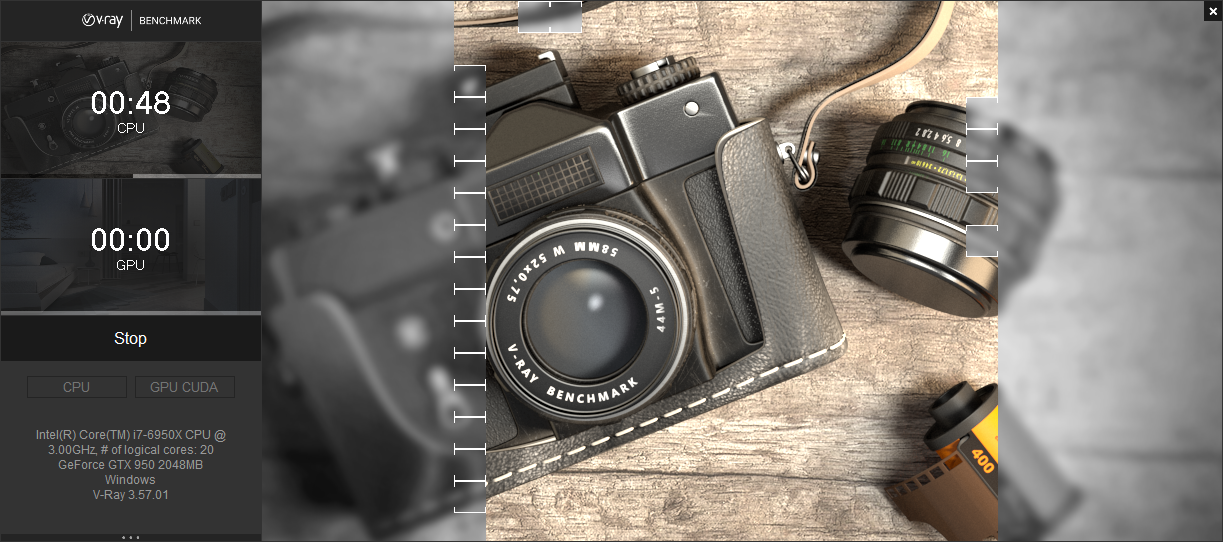
We run the standard standalone benchmark application, but in an automated fashion to pull out the result in the form of kilosamples/second. We run the test six times and take an average of the valid results.
Cinebench R20: Link
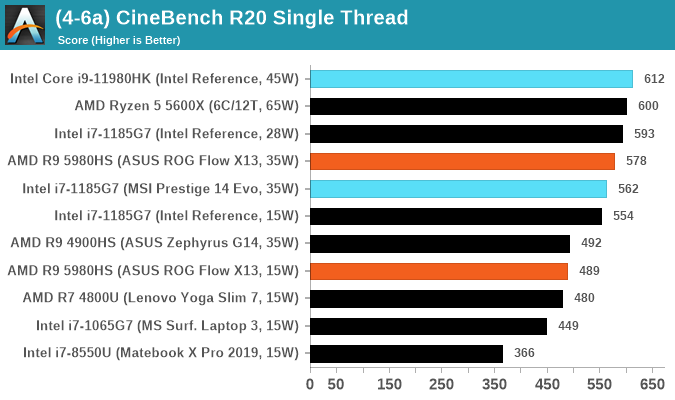
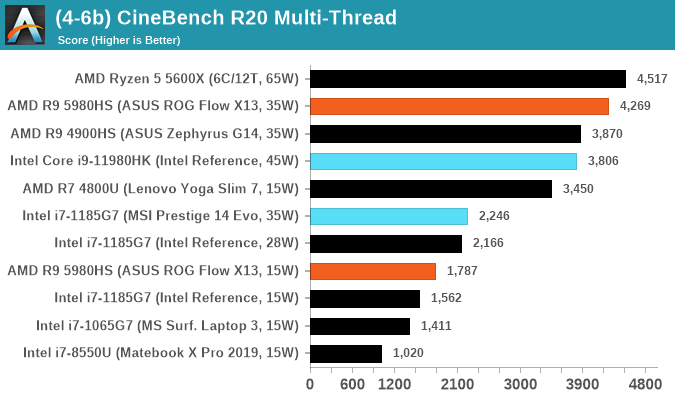
Another common stable of a benchmark suite is Cinebench. Based on Cinema4D, Cinebench is a purpose built benchmark machine that renders a scene with both single and multi-threaded options. The scene is identical in both cases. The R20 version means that it targets Cinema 4D R20, a slightly older version of the software which is currently on version R21. Cinebench R20 was launched given that the R15 version had been out a long time, and despite the difference between the benchmark and the latest version of the software on which it is based, Cinebench results are often quoted a lot in marketing materials.
Results for Cinebench R20 are not comparable to R15 or older, because both the scene being used is different, but also the updates in the code bath. The results are output as a score from the software, which is directly proportional to the time taken. Using the benchmark flags for single CPU and multi-CPU workloads, we run the software from the command line which opens the test, runs it, and dumps the result into the console which is redirected to a text file. The test is repeated for a minimum of 10 minutes for both ST and MT, and then the runs averaged.


229 Comments
View All Comments
Andrei Frumusanu - Monday, May 17, 2021 - link
As a note, we're just finishing up this review at the very last minute due to us getting our hands on the reference laptop only in the last 48h. I'll be completing the missing page texts in the next few hours as we're tidying up the article.EliteRetard - Monday, May 17, 2021 - link
Did you have a description/specs of the test systems?If it was there I missed it, even after going back to look.
Differences in RAM / storage etc. can affect some tests.
I'm guessing the size based on the name of the Asus...
Looks like you're comparing a 16" workstation vs a 13" thin/light?
Would the AMD CPU perform better in a larger/cooler chassis?
timecop1818 - Tuesday, May 18, 2021 - link
> Would the AMD CPU perform betterlol
Spunjji - Tuesday, May 18, 2021 - link
> timecop1818lol
Qasar - Tuesday, May 18, 2021 - link
gotta love timecrap181...at_clucks - Wednesday, May 19, 2021 - link
Come on, the Intel CPU actually performs decently... for a slowish desktop CPU stuck in a laptop chassis. Still not that bad.Spunjji - Thursday, May 20, 2021 - link
It performs very well, but timcarp1488 was completely misreading what had actually been said just to shitpost his usual anti-AMD nonsense.Spunjji - Tuesday, May 18, 2021 - link
"Did you have a description/specs of the test systems?"A brief description of the Intel reference system is in this review, more detail of the AMD system is available in the review these test results came from.
"Would the AMD CPU perform better in a larger/cooler chassis?"
A 45W variant of the AMD CPU in a larger chassis would see higher sustained multi-core performance, but single-core is probably quite similar.
Gondalf - Wednesday, May 19, 2021 - link
Strange article Andrei.5980HS is rated 35-54 W or 45W+. How can you judge that 45W Intel is less efficient?? Have you data about TDP settings of Asus X13 ? Likely the AMD SKU run at the highest TDP for more performance on Asus device, for several minutes or continuously.
Bet you neeed to be more informed in your articles, OEMs can go at the max TDP of a cpu since the Tskin of the laptop allow this.
Bet Intel Tiger Lake H will be faster than in your article on the right chassis ?
Bet direct power measures are better than generic comments ?
Retycint - Thursday, May 20, 2021 - link
Strange comment Gondalf.The graph of the 5980HS on page 2 shows that the Asus X13 runs at 42W for about 300s and then drops to 35W for the rest of the time.
Bet you didn't read the article and just came down instantly to try and feel smug?
Bet you need to be more informed when making hate posts?