The 2020 Mac Mini Unleashed: Putting Apple Silicon M1 To The Test
by Andrei Frumusanu on November 17, 2020 9:00 AM ESTRosetta2: x86-64 Translation Performance
The new Apple Silicon Macs being based on a new ISA means that the hardware isn’t capable of running existing x86-based software that has been developed over the past 15 years. At least, not without help.
Apple’s new Rosetta2 is a new ahead-of-time binary translation system which is able to translate old x86-64 software to AArch64, and then run that code on the new Apple Silicon CPUs.
So, what do you have to do to run Rosetta2 and x86 apps? The answer is pretty much nothing. As long as a given application has a x86-64 code-path with at most SSE4.2 instructions, Rosetta2 and the new macOS Big Sur will take care of everything in the background, without you noticing any difference to a native application beyond its performance.
Actually, Apple’s transparent handling of things are maybe a little too transparent, as currently there’s no way to even tell if an application on the App Store actually supports the new Apple Silicon or not. Hopefully this is something that we’ll see improved in future updates, serving also as an incentive for developers to port their applications to native code. Of course, it’s now possible for developers to target both x86-64 and AArch64 applications via “universal binaries”, essentially just glued together variants of the respective architecture binaries.
We didn’t have time to investigate what software runs well and what doesn’t, I’m sure other publications out there will do a much better job and variety of workloads out there, but I did want to post some more concrete numbers as to how the performance scales across different time of workloads by running SPEC both in native, and in x86-64 binary form through Rosetta2:
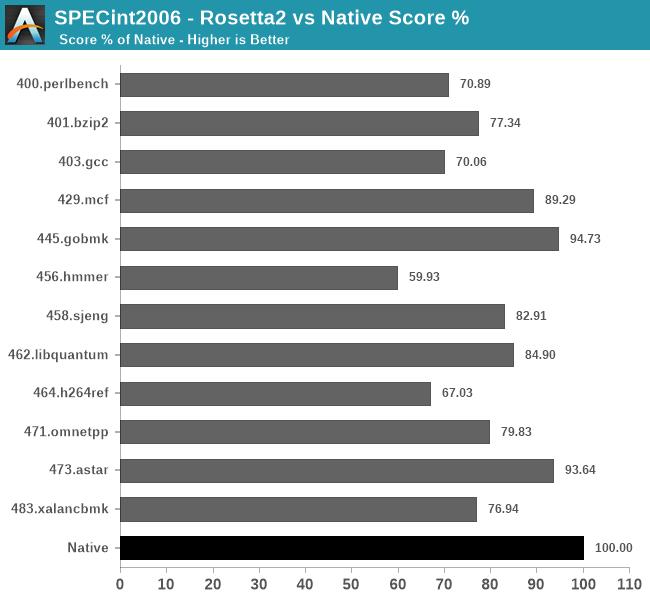
In SPECint2006, there’s a wide range of performance scaling depending on the workloads, some doing quite well, while other not so much.
The workloads that do best with Rosetta2 primarily look to be those which have a more important memory footprint and interact more with memory, scaling perf even above 90% compared to the native AArch64 binaries.
The workloads that do the worst are execution and compute heavy workloads, with the absolute worst scaling in the L1 resident 456.hmmer test, followed by 464.h264ref.
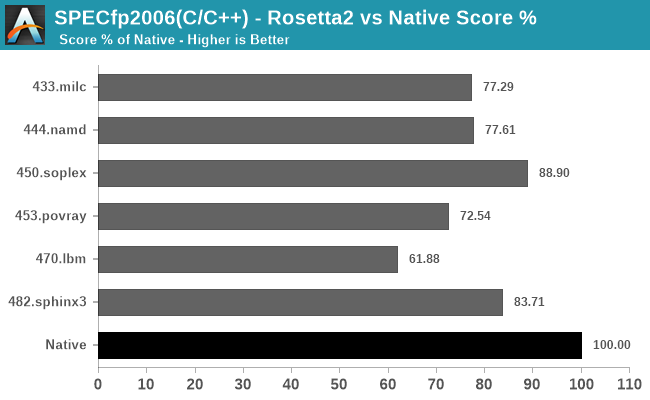
In the fp2006 workloads, things are doing relatively well except for 470.lbm which has a tight instruction loop.
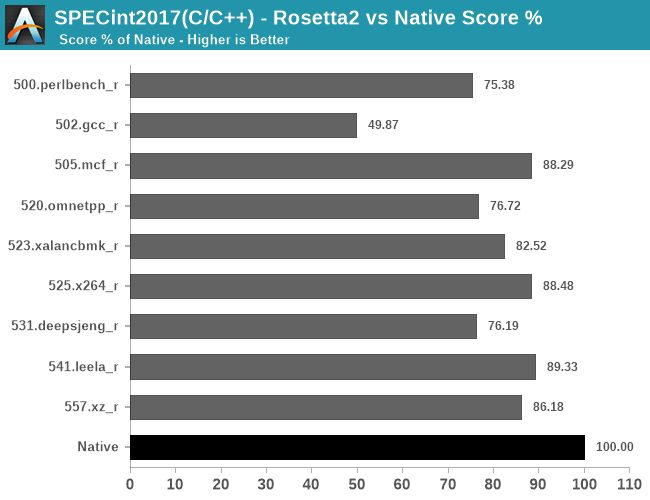
In the int2017 tests, what stands out is the horrible performance of 502.gcc_r which only showcases 49.87% performance of the native workload – probably due to high code complexity and just overall uncommon code patterns.
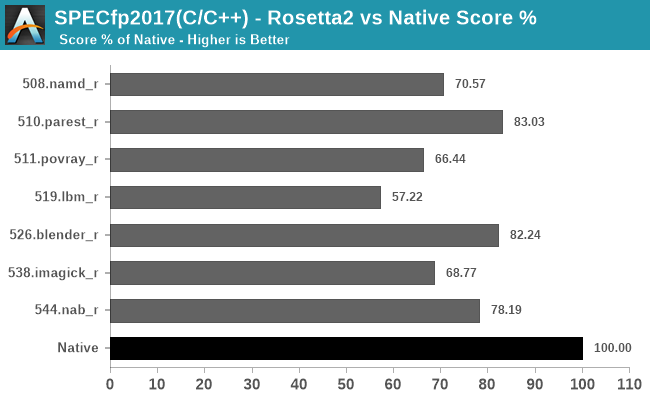
Finally, in fp2017, it looks like we’re again averaging in the 70-80% performance scale, depending on the workload’s code.
Generally, all of these results should be considered outstanding just given the feat that Apple is achieving here in terms of code translation technology. This is not a lacklustre emulator, but a full-fledged compatibility layer that when combined with the outstanding performance of the Apple M1, allows for very real and usable performance of the existing software application repertoire in Apple’s existing macOS ecosystem.


682 Comments
View All Comments
Ppietra - Tuesday, November 24, 2020 - link
Sorry, but no! What you showed for the 4800U isn’t the power draw of the computer, it’s the power draw of a processor doing a completely different test in an unnamed computer in unknown settings. Not to mention that this M1 analysis is with a desktop computer not a laptop. Why are you trying to deceive?If you want to see computer power consumption go to Tally Ho Tech youtube channel, you will see how a laptop with the 4800U consumes around 3 times more in Cinebench than a laptop with a M1 chip.
BushLin - Tuesday, November 24, 2020 - link
Oh... I have to wade through some random YouTube channel to see some other flawed comparison? If you can link to an objective test showing actual power draw, post the link.Ppietra - Tuesday, November 24, 2020 - link
hmmm! So you complain about a channel doing a straightforward comparison in similar conditions, but you have no problems in using different kinds of power consumption from completely different tests to validate your "theory". Grand!!For the record thunng8 links shows you the power consumption of the M1 in a Cinebench test done by Anandtech’ author.
BushLin - Tuesday, November 24, 2020 - link
No, I'm continuing to complain that you don't post a link to your evidence, I'm not sitting through every YouTube video of some random when in the next breath you refer again to a forum post linked by thunng8 which is for a different, 4700U CPU.No amount of FUD changes the fact that the M1 is great at single thread, especially for the power but isn't the Jesus CPU you dream it to be in multithreaded workloads.
Put up or shut up.
Ppietra - Tuesday, November 24, 2020 - link
I have said nothing about a 4700U CPU nor referred to links to talk about AMD CPUs. I very clearly only mentioned M1 data when referring to thunng8 links. Neither have I said that the M1 had the highest performance of all, I only talked about power consumption.https://www.youtube.com/watch?v=wuvZQOUDCKY
BushLin - Tuesday, November 24, 2020 - link
Great YouTube video, didn't measure the power draw. Yet you're the one throwing around words like deceive.Ppietra - Tuesday, November 24, 2020 - link
Didn’t measure the power draw? Really?So showing battery level change after 10 minute Cinebench test, with known battery capacities, isn’t sufficient data to determine approximate power draw? Not even enough to give you an idea? A little bit of basic math, then!
16% drop in a 60.7Wh battery gives 9.7Wh of energy use for the AMD laptop. If you prefer in watts, since it was a 10 minute run that gives 58W.
6% drop in a 58Wh battery gives 3.5Wh of energy used for the MacBook Pro. In a 10 minute run that gives 21W, to do the same task.
From a previous video the Cinebench MT scores were 9976 for AMD and 7800 for the MacBook.
If you normalize energy consumption to the Cinebench score, that would mean the MacBook Pro consumes less than half for the same performance!
BushLin - Tuesday, November 24, 2020 - link
What are the cinebench results when running on battery? What is the battery's actual capacity and how fast does it drain when fully loaded? How does the system report battery percentage vs voltage of the cells? How much power does the screen consume? Can you trust the person making the video to be thorough and objective?Could go on and on, or just stick a $15 meter on the AC plug and actually measure it.
Ppietra - Tuesday, November 24, 2020 - link
?? I gave you the Cinebench results. I gave the actual battery capacity, I gave how much it drained when running Cinebench and in what time interval - it is all in the videos!How much power does the screen consume??? REALLY!!!? For someone who argued for the use of "power measurement" "at the wall rather than just the SoC " to now come and argue against measuring the battery power drain in a 10 minutes test it is laughable. Even more so when in the end you make another U turn and just argue about measuring power at the plug - so the screen doesn’t matter now!??
Just face reality M1 power consumption has been measured at 15W in Cinebench, by Anandtech. 4800U power consumption can go higher than 25W since it can be boosted to 35W.
BushLin - Tuesday, November 24, 2020 - link
Since you're either a troll or insane, I'm not going to expend any further effort beyond answering this:"Just face reality M1 power consumption has been measured at 15W in Cinebench, by Anandtech"
With this:
https://images.anandtech.com/graphs/graph16252/119...