Intel’s Tiger Lake 11th Gen Core i7-1185G7 Review and Deep Dive: Baskin’ for the Exotic
by Dr. Ian Cutress & Andrei Frumusanu on September 17, 2020 9:35 AM EST- Posted in
- CPUs
- Intel
- 10nm
- Tiger Lake
- Xe-LP
- Willow Cove
- SuperFin
- 11th Gen
- i7-1185G7
- Tiger King
Section by Andrei Frumusanu
CPU ST Performance: SPEC 2006, SPEC 2017
SPEC2017 and SPEC2006 is a series of standardized tests used to probe the overall performance between different systems, different architectures, different microarchitectures, and setups. The code has to be compiled, and then the results can be submitted to an online database for comparison. It covers a range of integer and floating point workloads, and can be very optimized for each CPU, so it is important to check how the benchmarks are being compiled and run.
We run the tests in a harness built through Windows Subsystem for Linux, developed by our own Andrei Frumusanu. WSL has some odd quirks, with one test not running due to a WSL fixed stack size, but for like-for-like testing is good enough. SPEC2006 is deprecated in favor of 2017, but remains an interesting comparison point in our data. Because our scores aren’t official submissions, as per SPEC guidelines we have to declare them as internal estimates from our part.
For compilers, we use LLVM both for C/C++ and Fortan tests, and for Fortran we’re using the Flang compiler. The rationale of using LLVM over GCC is better cross-platform comparisons to platforms that have only have LLVM support and future articles where we’ll investigate this aspect more. We’re not considering closed-sourced compilers such as MSVC or ICC.
clang version 10.0.0

clang version 7.0.1 (ssh://git@github.com/flang-compiler/flang-driver.git

 24bd54da5c41af04838bbe7b68f830840d47fc03)
-Ofast -fomit-frame-pointer

-march=x86-64

-mtune=core-avx2

-mfma -mavx -mavx2
Our compiler flags are straightforward, with basic –Ofast and relevant ISA switches to allow for AVX2 instructions. We decided to build our SPEC binaries on AVX2, which puts a limit on Haswell as how old we can go before the testing will fall over. This also means we don’t have AVX512 binaries, primarily because in order to get the best performance, the AVX-512 intrinsic should be packed by a proper expert, as with our AVX-512 benchmark.
To note, the requirements for the SPEC licence state that any benchmark results from SPEC have to be labelled ‘estimated’ until they are verified on the SPEC website as a meaningful representation of the expected performance. This is most often done by the big companies and OEMs to showcase performance to customers, however is quite over the top for what we do as reviewers.
Starting off with our SPEC2006 analysis for Tiger Lake, given that we’re extremely familiar with the microarchitectural characteristics of these workloads:
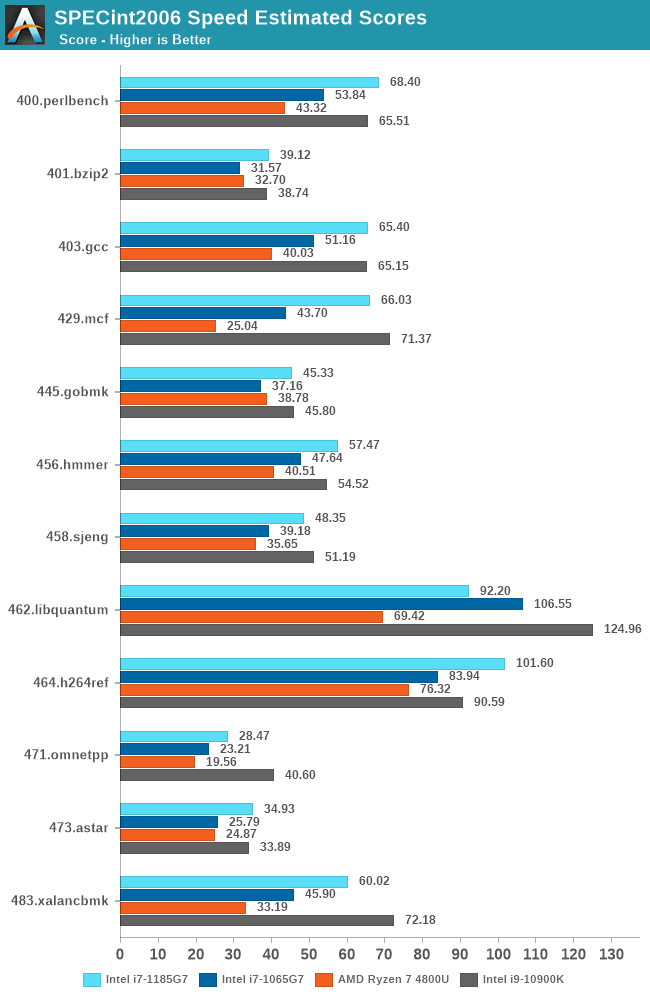
As a note, the Tiger Lake figures published in the detailed sub-scores represent the 28W TDP configuration option of the platform, with the core mostly clocking to 4800MHz and all other aspects the device allowing for maximum speed. This allows us for a pure microarchitectural analysis.
The generational improvements of the new Sunny Cove design here is showing very much its advertised characteristics of the microarchitecture.
Starting off with high-IPC and backend execution-bound workloads such as 456.hmmer we’re seeing a near linear performance increase with clock frequency. Sunny Cove here had larger IPC improvements but the Ice Lake design was rather limited in its clock frequency, most of the time still losing out to higher-clocked Skylake designs.
This time around with the major frequency boost, the Tiger Lake chip is able to even outperform the desktop i7-10900K at 5.3GHz as long as memory doesn’t become a bottleneck.
IPC/performance-per-clock wise, things are mostly flat between generation at +-2% depending on workloads, but 473.astar does seem to like the Willow Cove architecture as we’re seeing a +10% boost. 403.gcc’s 4% IPC improvement also likely takes advantage of the larger L2 cache of the design, whilst 429.mcf’s very latency sensitive nature sees a huge 23% IPC boost thanks to the strong memory controllers of Tiger Lake.
462.libquantum doesn’t fare well at all as we’re not only seeing a 30% reduction in IPC, but absolute performance is actually outright worse than Ice Lake. This workload is bandwidth hungry. The theory is that if it has a mostly cache-resident workload footprint, then it would generally make sense to see such a perf degradation due to the L3’s overall degraded generational performance. It’s an interesting aspect we’ll also see in 470.lbm.
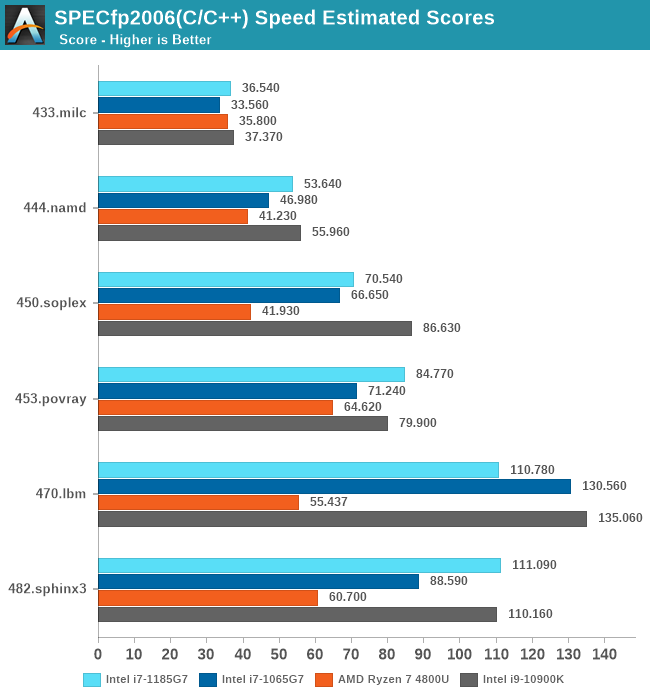
In the floating-point workloads, we again see the Tiger Lake chip doing extremely well, but there are some outliers. As mentioned 470.lbm is which is also extremely bandwidth hungry sees a generational degradation, which again could be L3 related, or something more specific to the memory subsystem.
There’s actually a wider IPC degradation in this set, with 482.sphinx being the only positive workload with a +2% boost, while the rest fall in a -12%, -7%, -14%, -3% and that massive -31% degradation for 470.lbm. Essentially, all workload which have stronger memory pressure characteristics.
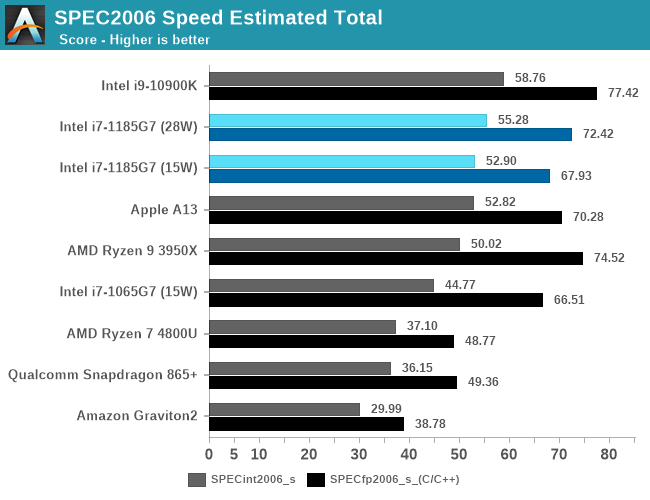
Overall SPEC2006 score performance for Tiger Lake is extremely good. Here we also present the 15W vs 28W configuration figures for the single-threaded workloads, which do see a jump in performance by going to the higher TDP configuration, meaning the design is thermally constrained at 15W even in ST workloads. By the way, this is a core power consumption limitation, as even small memory footprint workloads see a performance jump.
The i7-1185G7 is at the heels of the desktop i9-10900K, trailing only by a few percentage points.
Against the x86 competition, Tiger Lake leaves AMD’s Zen2-based Renoir in the dust when it comes to single-threaded performance. Comparing it against Apple’s A13, things aren’t looking so rosy as the Intel CPU barely outmatches it even though it uses several times more power, which doesn’t bode well for Intel once Apple releases its “Apple Silicon” Macbooks.
Even against Arm’s Cortex-A77 things aren’t looking rosy, as the x86 crowd just all that much ahead considering the Arm design only uses 2W.
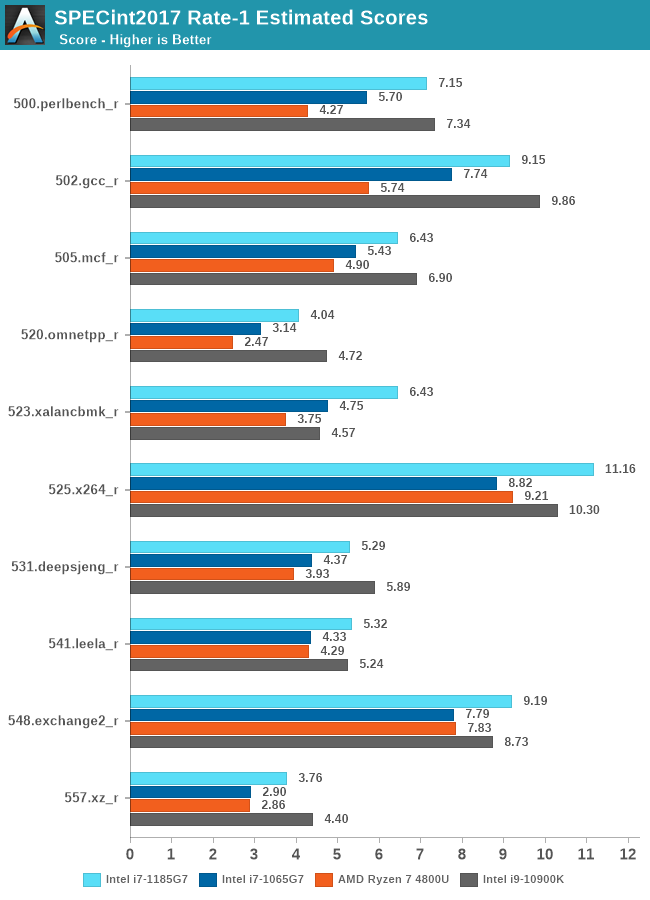
Moving onto the newer SPEC2017 suite, we’re seeing a quite similar story across the scaling between the platforms. Tiger Lake and its Willow Cove cores are showcasing outstanding performance as long as things are execution-bound, however do fall behind a bit to the desktop system when memory comes into play. There are two sets of results here, workloads which have high bandwidth or latency requirements, or those which have large memory footprint requirements.
523.xalancbmk_r seems to be of the latter as it’s posting a quite nice 10% IPC jump for Willow Cove while the rest generally in-between -4% regressions or +3-5% improvements.
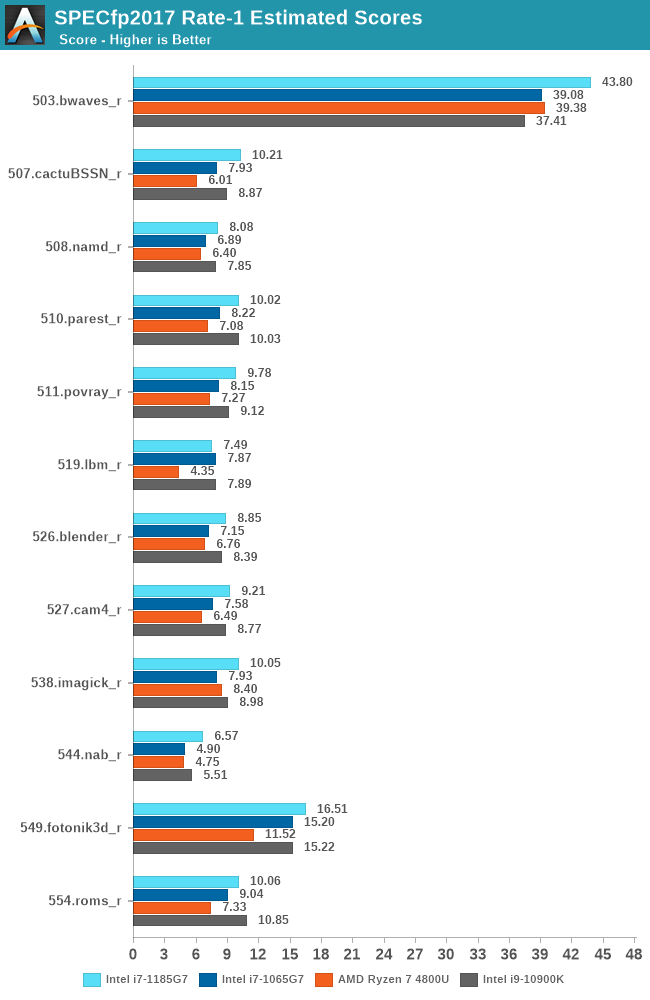
In the FP suite, we mostly see again the same kind of characteristics, with performance most of the time scaling in line with the clock frequency of Tiger Lake, with a few outliers here and there in terms of IPC, such as 544.nab_r gaining +9%, or 549.fotonik3d_r regressing by 12%.
Much like in the 2006 suite, the memory bandwidth hungry 519.lbm_r sees a 23% IPC regression, also regressing its absolute performance below that of Ice Lake.
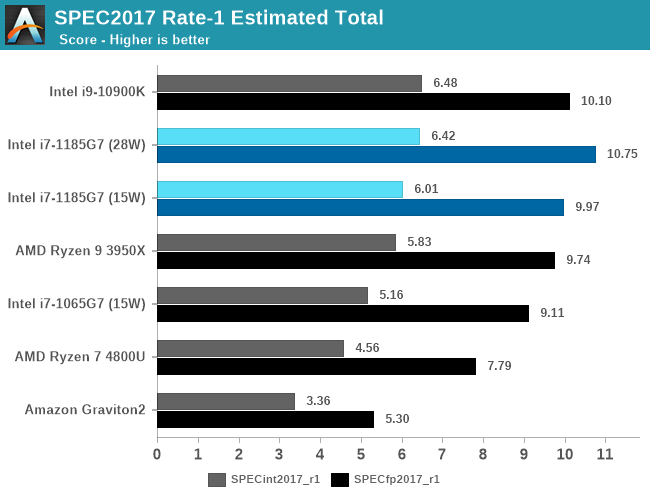
Overall, in the 2017 scores, Tiger Lake actually comes in as the leading CPU microarchitecture if you account both the integer and float-point scores together.
Although the design’s absolute performance here is exemplary, I feel a bit disappointed that in general the majority of the performance gains seen today were due to the higher clock frequencies of the new design.
IPC improvements of Willow Cove are quite mixed. In some rare workloads which can fully take advantage of the cache increases we’re seeing 9-10% improvements, but these are more of an exception rather than the rule. In other workloads we saw some quite odd performance regressions, especially in tests with high memory pressure where the design saw ~5-12% regressions. As a geometric mean across all the SPEC workloads and normalised for frequency, Tiger Lake showed 97% of the performance per clock of Ice Lake.
In a competitive landscape where AMD is set to make regular +15% generational IPC improvements and Arm now has an aggressive roadmap with yearly +30% IPC upgrades, Intel’s Willow Cove, although it does deliver great performance, seems to be a rather uninspiring microarchitecture.


253 Comments
View All Comments
huangcjz - Thursday, September 17, 2020 - link
No, you can say "have to hand" as in something which is available. E.g. "Do you have the presentation to hand?"29a - Thursday, September 17, 2020 - link
Wouldn't a non Iris chip be a fairer comparison to Renoir?Kamen Rider Blade - Thursday, September 17, 2020 - link
AMD's 4800U has a 25 watt mode, Hardware UnBoxed tested it against Intel.Why didn't you test it and put those results in the chart?
Why this biased reviewing of one side gets 15 watt and 28 watt scores.
Yet AMD isn't allowed to show 25 watt scores?
What are you afraid of when comparing like for like?
IanCutress - Thursday, September 17, 2020 - link
For us, the 15W to 15W results were the focal point. 28W is there to show a max Intel and look at scaling. Also, The amount of 4800U devices at 25W is minimal.Not only that, I'm on holiday. I had to spend two days out, while in this lovely cottage in the countryside, to write 18k words, rather than spend time with my family. I had 4 days with the TGL laptop, and 8 days notice in advance to prepare before the deadline. Just me with a couple of pages from Andrei, no-one else. Still posted the review 30 minutes late, while writing it in a pub as my family had lunch. Had to take the amd laptop with me to test, and it turns out downloading Borderlands 3 in the middle of nowhere is a bad idea.
Not only that, I've been finishing up other projects last week. I do what I can in the time I have. This review is 21k words and more detailed than anything else out there done by a single person currently in the middle of a vacation. If you have further complains, our publisher's link is at the bottom of the webpage. Or roll your own. What are you afraid of? I stand by my results and my work ethic.
PixyMisa - Thursday, September 17, 2020 - link
I really appreciate the effort. The individual SPEC results are vastly more useful than (for example) a single Geekbench score.Spunjji - Friday, September 18, 2020 - link
I can second that - I appreciate seeing a breakdown of the strengths/weaknesses of each core design.Kamen Rider Blade - Friday, September 18, 2020 - link
We appreaciate your hard work, I do watch your YT channel Tech Tech Potato. That being said, if you knew about this issue, with not comparing like for like; then just omit the 28 W scores from the Intel machine and just focus on Intel's 15W vs AMD's 15W.Why even include the 28W on the chart? You know how this makes you and Anandtech look, right? The issues of bias towards or against any entity could've been easily avoided if you had "Like for like" scores across the board. That's part of what Steve from Gamers Nexus and many of us enthusiast see's as "Bias Marketing" or "Paid Shilling" to manipulate results in one way or another. Many people can easily interpret your data of not showing "like for like" in many wrong ways when they have no context for it.
If you didn't want to test AMD's 25 watt scores, nobody would care, just don't bring up Intel's equivalent 28 watt scores. Alot of the more casual readers won't look at the details and they can easily mis-interpret things. I prefer that your good name doesn't get dragged down in mud with a simple omission of certain benchmark figures. I know you wouldn't deliberately do that to show bias towards one entity or another, but will other folks know that?
Spunjji - Friday, September 18, 2020 - link
Presenting the figures he has isn't bias. Bias would be proclaiming Intel to be the winner without noting the discrepancy, or specifically choosing tests to play to the strength of one architecture.As it is, the Lenovo device doesn't do a 25W mode, so you're asking him to add a full extra device's worth of testing to an already long review. That's a bit much.
If you take a look at the 65W APU results and compare them, you'll see a familiar story for Renoir - there's not actually a whole lot of extra gas in the tank to be exploited by a marginally higher TDP. It performs spectacularly well at 15W, and that's that.
Kamen Rider Blade - Friday, September 18, 2020 - link
You can literally just omit the 65W APU, it has no relevance to be on that chart.Ok, if that Lenovo LapTop doesn't offer a 25W mode, fine. Maybe Hardware Unboxed got a different model of LapTop for the 4800U. Then don't present Intel's 28W mode.
That's how people misunderstand things when there is a deliberate omission of information or extra information that the other side doesn't happen. The lack of pure like for like causes issues.
Spunjji - Saturday, September 19, 2020 - link
You're *demanding bias*. They had the Intel device with a 28W mode, 28W figures are a big part of the TGL proposition, so they tested it and labelled it all appropriately. That isn't bias.The "lack of pure like for like" only causes issues if you don't really pay attention to what the article says about what they had and how they tested it.