Intel’s Tiger Lake 11th Gen Core i7-1185G7 Review and Deep Dive: Baskin’ for the Exotic
by Dr. Ian Cutress & Andrei Frumusanu on September 17, 2020 9:35 AM EST- Posted in
- CPUs
- Intel
- 10nm
- Tiger Lake
- Xe-LP
- Willow Cove
- SuperFin
- 11th Gen
- i7-1185G7
- Tiger King
CPU Performance: Office and Web
Our previous set of ‘office’ benchmarks have often been a mix of science and synthetics, so this time we wanted to keep our office section purely on real world performance.
Agisoft Photoscan 1.3.3: link
Photoscan stays in our benchmark suite from the previous benchmark scripts, but is updated to the 1.3.3 Pro version. As this benchmark has evolved, features such as Speed Shift or XFR on the latest processors come into play as it has many segments in a variable threaded workload.
The concept of Photoscan is about translating many 2D images into a 3D model - so the more detailed the images, and the more you have, the better the final 3D model in both spatial accuracy and texturing accuracy. The algorithm has four stages, with some parts of the stages being single-threaded and others multi-threaded, along with some cache/memory dependency in there as well. For some of the more variable threaded workload, features such as Speed Shift and XFR will be able to take advantage of CPU stalls or downtime, giving sizeable speedups on newer microarchitectures.
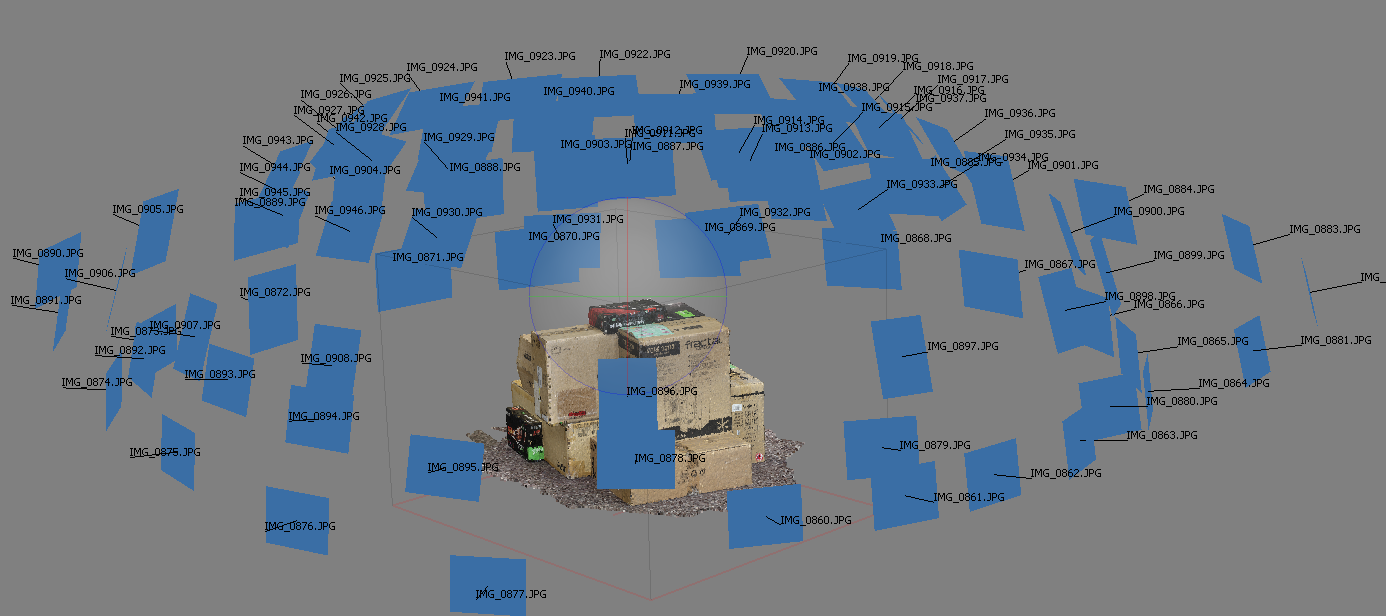
For the update to version 1.3.3, the Agisoft software now supports command line operation. Agisoft provided us with a set of new images for this version of the test, and a python script to run it. We’ve modified the script slightly by changing some quality settings for the sake of the benchmark suite length, as well as adjusting how the final timing data is recorded. The python script dumps the results file in the format of our choosing. For our test we obtain the time for each stage of the benchmark, as well as the overall time.
The final result is a table that looks like this:
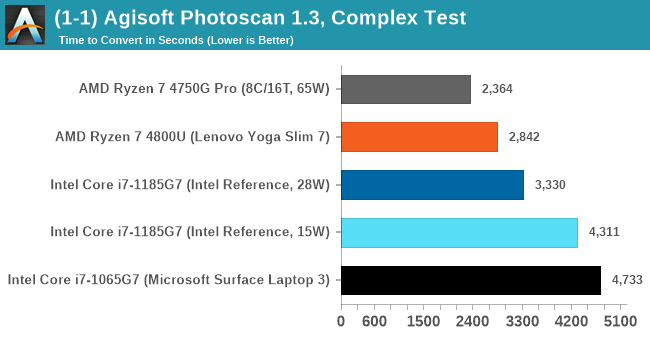
As explained in the power tests, the 4800U with double the cores wins out here, and due to the vector pressure also wins on power efficiency. There’s still a sizeable uplift from Ice Lake to Tiger Lake at 15 W, although 28 W is needed to get something sizeable.
Mozilla Kraken 1.1
Kraken is a 2010 benchmark from Mozilla and does a series of JavaScript tests. These tests are a little more involved than previous tests, looking at artificial intelligence, audio manipulation, image manipulation, json parsing, and cryptographic functions. The benchmark starts with an initial download of data for the audio and imaging, and then runs through 10 times giving a timed result.
Automation involves loading the direct webpage where the test is run and putting it through. All CPUs finish the test in under a couple of minutes, so we put that as the end point and copy the page contents into the clipboard before parsing the result. Each run of the test on most CPUs takes from half-a-second to a few seconds.
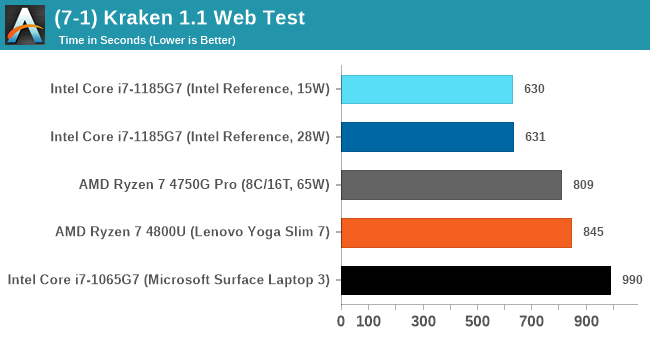
Both the Tiger Lake results are very fast, not showing much difference between the power modes. Intel pushes ahead of AMD here, and ultimately a sizable jump over Ice Lake.
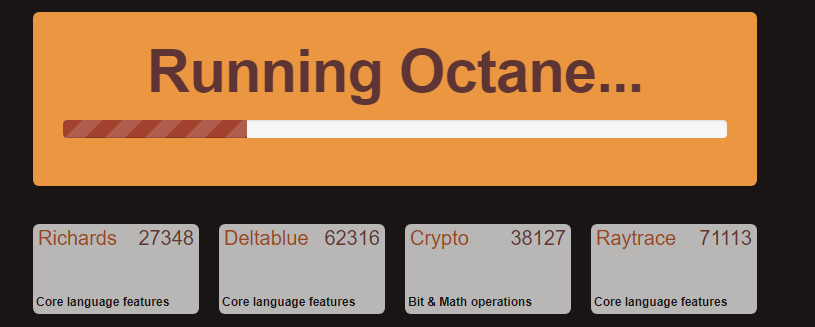
Google Octane 2.0
Our second test is also JavaScript based, but uses a lot more variation of newer JS techniques, such as object-oriented programming, kernel simulation, object creation/destruction, garbage collection, array manipulations, compiler latency and code execution.
Octane was developed after the discontinuation of other tests, with the goal of being more web-like than previous tests. It has been a popular benchmark, making it an obvious target for optimizations in the JavaScript engines. Ultimately it was retired in early 2017 due to this, although it is still widely used as a tool to determine general CPU performance in a number of web tasks.
Octane’s automation is a little different than the others: there is no direct website to go to in order to run the benchmark. The benchmark page is opened, but the user has to navigate to the ‘start’ button or open the console and initiate the JavaScript required to run the test. The test also does not show an obvious end-point, but luckily does try and aim for a fixed time for each processor. This is similar to some of our other tests, that loop around a fixed time before ending. Unfortunately this doesn’t work if the first loop goes beyond that fixed time, as the loop still has to finish. For Octane, we have set it to 75 seconds per run, and we loop the whole test four times.
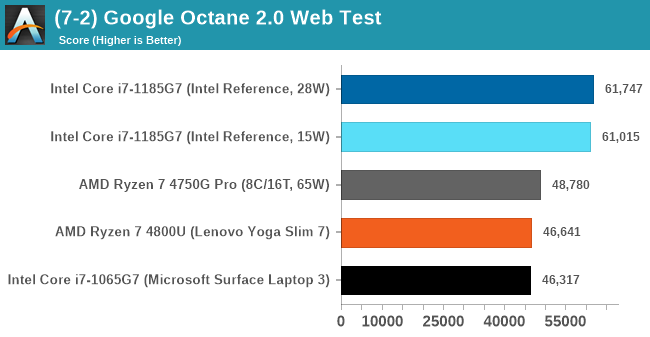
The Tiger Lake system reaches new records in Optane. If there’s anything this system is fast at, it is web workloads.
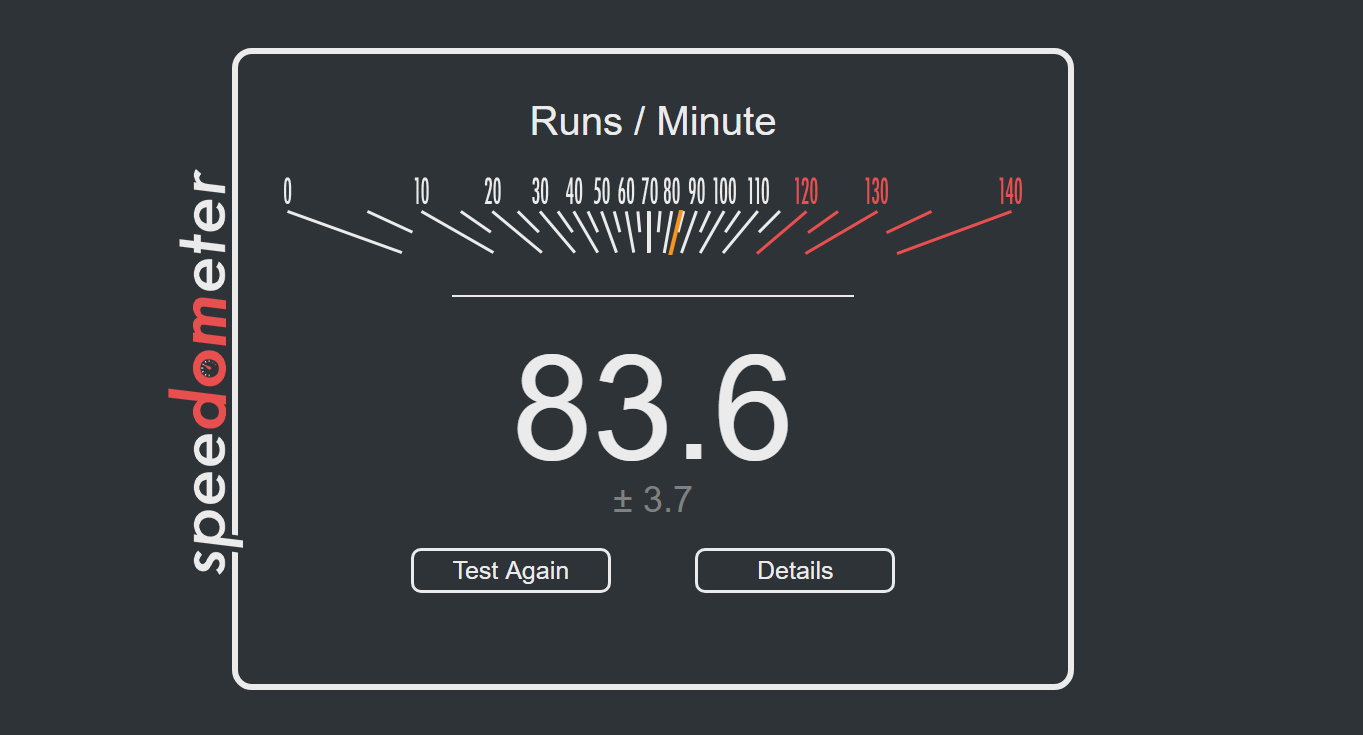
Speedometer 2: JavaScript Frameworks
Our newest web test is Speedometer 2, which is a test over a series of JavaScript frameworks to do three simple things: built a list, enable each item in the list, and remove the list. All the frameworks implement the same visual cues, but obviously apply them from different coding angles.
Our test goes through the list of frameworks, and produces a final score indicative of ‘rpm’, one of the benchmarks internal metrics. Rather than use the main interface, we go to the admin interface through the about page and manage the results there. It involves saving the webpage when the test is complete and parsing the final result.
We repeat over the benchmark for a dozen loops, taking the average of the last five.
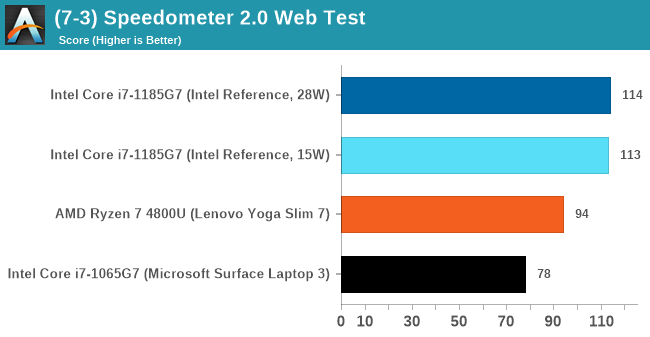
Again, another good win for Tiger Lake.


253 Comments
View All Comments
JayNor - Thursday, September 17, 2020 - link
I noted from Intel's Thunderbolt 3 documents that the ports are bidirectional and can, for example, support pcie send while receiving display port on the same cable.Is it possible, for example, to use an external GPU card with one cable to display output on your laptop's display?
Spunjji - Friday, September 18, 2020 - link
I understand that you can, but it drops performance significantly.Spunjji - Thursday, September 17, 2020 - link
Oof, those GPU benchmarks are painful. It's become clear that their predictions were all based on LPDDR5PeachNCream - Thursday, September 17, 2020 - link
Yes the GPU results are somewhat disappointing, but there is only so much you can do when sharing bandwidth to RAM with the CPU cores and everything else. Of course, there is also significant latency to contend with when you don't have GDDR5/6 available to the graphics processor.Spunjji - Friday, September 18, 2020 - link
Absolutely - it's become pretty clear that's why AMD decided to go with 8 CUs on Renoir. I wasn't expecting anything huge from Xe on TGL, but Intel were pushing it as a big win and really it's just not - at least, not in this form. A ~20% bandwidth boost might well translate into big gains on later devices.JayNor - Saturday, September 19, 2020 - link
false, they used lpddr4x for the benchmarks.Spunjji - Saturday, September 19, 2020 - link
I think perhaps you misread what I said. Intel were previously showing numbers suggesting a huge leap in performance for their Xe iGPU which isn't borne out by the testing done here. I'm suggesting that it's because Intel were quoting numbers based on an LPDDR5 implementation. They could have just been lying, though. You seem to be suggesting the latter?undervolted_dc - Thursday, September 17, 2020 - link
Ok but why there are no power consumption of the ryzen ? I see a 28w tiger lake which have a peak of 50+ and an average of 35 and another "28w" tiger lake which instaed have a peak of 50+ and an average of 38w..,is the 4800u in thermal throttling because the tiger lake is better cooled ? this "reference" and the lack of real power usage comparision is "strange" to me... we started from the intel benchmarks.. and now we hare here ... where will be in 1 more months when the tiger lake will be in stores with also it's prices.. will be still comparable to the 4800u? ( and I'm also sure that asus will not cover air intake for the tiger lake one to be able to sell them against the 4800u given the higher prices they have to ask .. )
and where we will be then when zen3/cezanne will be revealed ? you will see the zen3 ipc and freq gain in 1 month.. ( maybe even before tiger lake approach stores ) .. I see no Baskin here..
undervolted_dc - Friday, September 18, 2020 - link
Also ram is unfair for this comparison:intel LPDDR4X-4266
vs amd DDR4-3200
but again.. at the end of the day the only thing that matter is the price/performance/power-usage balance for laptop, and here I see only performance comparison..(in unknown thermal/power condition for tests) and with no words about price..
we see here a coming-soon quad core intel with a power usage higher than 1 year old 8 core amd which is also faster in full speed tests ( not in gpu , but it's the old navi chip )
yes, single core bench the intel win.. but their high freq single core are 20% higher freq than AMD ones, are 20% faster, and eat 50% more power , are ~1 year newer , and probably will costs 50% more.. so who is the real winner?
undervolted_dc - Friday, September 18, 2020 - link
a mere 4500u with lpddr4x show an average +17% improvements in benchmarks..https://optocrypto.com/amd-ryzen-4000-adding-suppo...