The Intel 9th Gen Review: Core i9-9900K, Core i7-9700K and Core i5-9600K Tested
by Ian Cutress on October 19, 2018 9:00 AM EST- Posted in
- CPUs
- Intel
- Coffee Lake
- 14++
- Core 9th Gen
- Core-S
- i9-9900K
- i7-9700K
- i5-9600K
CPU Performance: Web and Legacy Tests
While more the focus of low-end and small form factor systems, web-based benchmarks are notoriously difficult to standardize. Modern web browsers are frequently updated, with no recourse to disable those updates, and as such there is difficulty in keeping a common platform. The fast paced nature of browser development means that version numbers (and performance) can change from week to week. Despite this, web tests are often a good measure of user experience: a lot of what most office work is today revolves around web applications, particularly email and office apps, but also interfaces and development environments. Our web tests include some of the industry standard tests, as well as a few popular but older tests.
We have also included our legacy benchmarks in this section, representing a stack of older code for popular benchmarks.
All of our benchmark results can also be found in our benchmark engine, Bench.
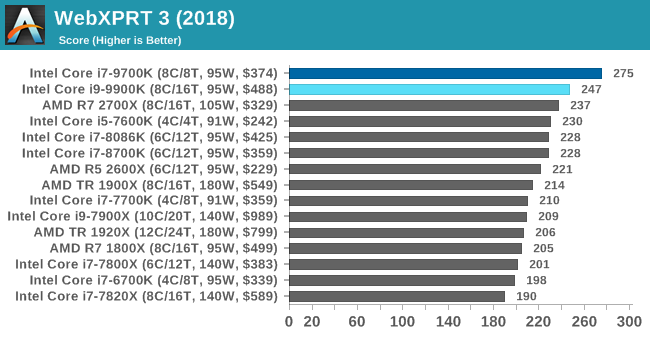
WebXPRT 3: Modern Real-World Web Tasks, including AI
The company behind the XPRT test suites, Principled Technologies, has recently released the latest web-test, and rather than attach a year to the name have just called it ‘3’. This latest test (as we started the suite) has built upon and developed the ethos of previous tests: user interaction, office compute, graph generation, list sorting, HTML5, image manipulation, and even goes as far as some AI testing.
For our benchmark, we run the standard test which goes through the benchmark list seven times and provides a final result. We run this standard test four times, and take an average.
Users can access the WebXPRT test at http://principledtechnologies.com/benchmarkxprt/webxprt/
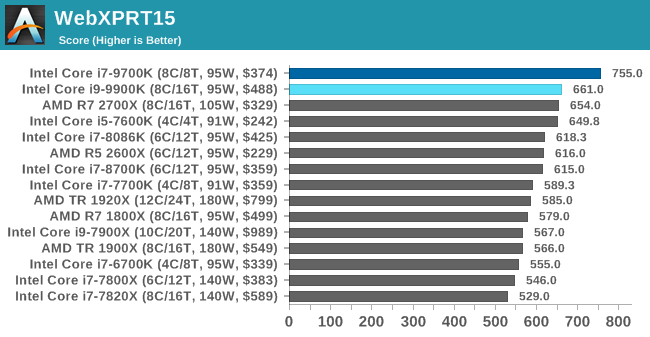
WebXPRT 2015: HTML5 and Javascript Web UX Testing
The older version of WebXPRT is the 2015 edition, which focuses on a slightly different set of web technologies and frameworks that are in use today. This is still a relevant test, especially for users interacting with not-the-latest web applications in the market, of which there are a lot. Web framework development is often very quick but with high turnover, meaning that frameworks are quickly developed, built-upon, used, and then developers move on to the next, and adjusting an application to a new framework is a difficult arduous task, especially with rapid development cycles. This leaves a lot of applications as ‘fixed-in-time’, and relevant to user experience for many years.
Similar to WebXPRT3, the main benchmark is a sectional run repeated seven times, with a final score. We repeat the whole thing four times, and average those final scores.
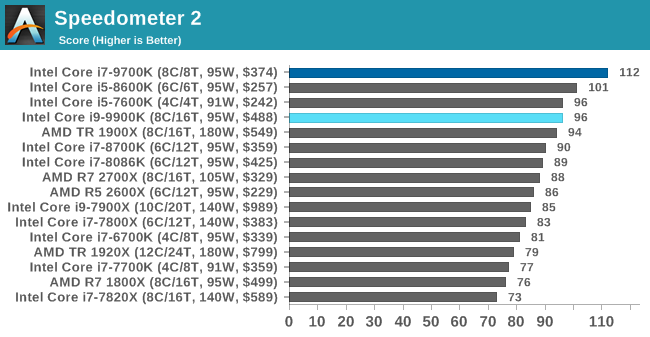
Speedometer 2: JavaScript Frameworks
Our newest web test is Speedometer 2, which is a accrued test over a series of javascript frameworks to do three simple things: built a list, enable each item in the list, and remove the list. All the frameworks implement the same visual cues, but obviously apply them from different coding angles.
Our test goes through the list of frameworks, and produces a final score indicative of ‘rpm’, one of the benchmarks internal metrics. We report this final score.
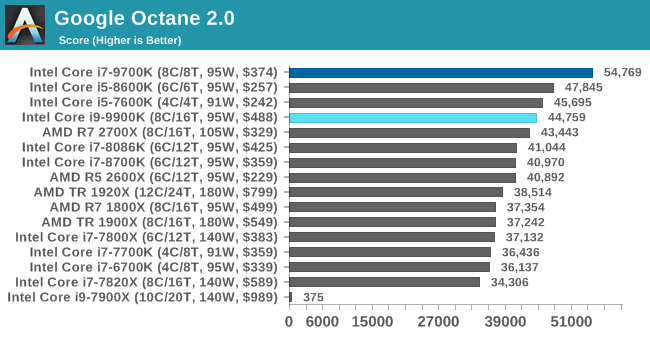
Google Octane 2.0: Core Web Compute
A popular web test for several years, but now no longer being updated, is Octane, developed by Google. Version 2.0 of the test performs the best part of two-dozen compute related tasks, such as regular expressions, cryptography, ray tracing, emulation, and Navier-Stokes physics calculations.
The test gives each sub-test a score and produces a geometric mean of the set as a final result. We run the full benchmark four times, and average the final results.
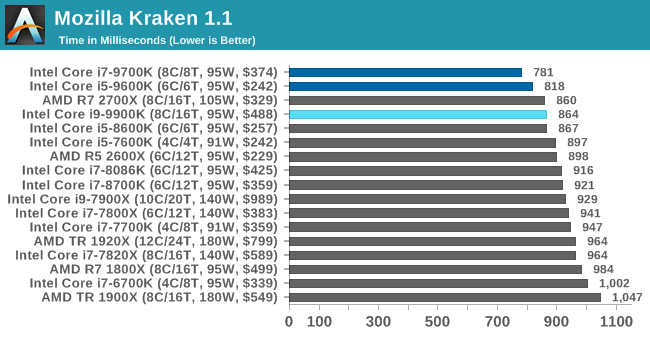
Mozilla Kraken 1.1: Core Web Compute
Even older than Octane is Kraken, this time developed by Mozilla. This is an older test that does similar computational mechanics, such as audio processing or image filtering. Kraken seems to produce a highly variable result depending on the browser version, as it is a test that is keenly optimized for.
The main benchmark runs through each of the sub-tests ten times and produces an average time to completion for each loop, given in milliseconds. We run the full benchmark four times and take an average of the time taken.
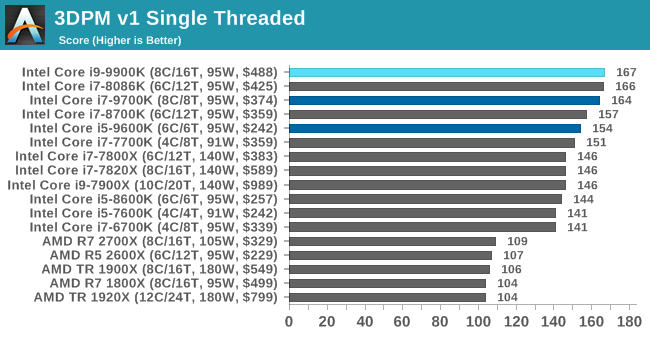
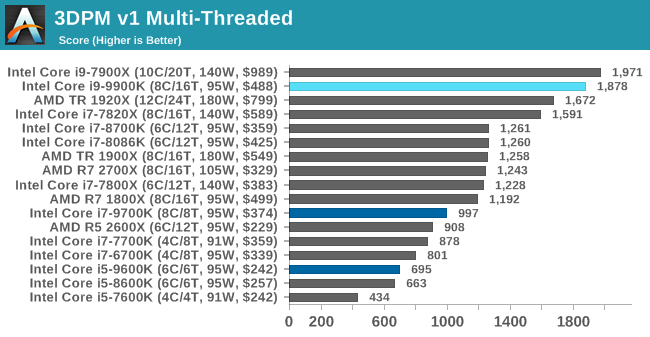
3DPM v1: Naïve Code Variant of 3DPM v2.1
The first legacy test in the suite is the first version of our 3DPM benchmark. This is the ultimate naïve version of the code, as if it was written by scientist with no knowledge of how computer hardware, compilers, or optimization works (which in fact, it was at the start). This represents a large body of scientific simulation out in the wild, where getting the answer is more important than it being fast (getting a result in 4 days is acceptable if it’s correct, rather than sending someone away for a year to learn to code and getting the result in 5 minutes).
In this version, the only real optimization was in the compiler flags (-O2, -fp:fast), compiling it in release mode, and enabling OpenMP in the main compute loops. The loops were not configured for function size, and one of the key slowdowns is false sharing in the cache. It also has long dependency chains based on the random number generation, which leads to relatively poor performance on specific compute microarchitectures.
3DPM v1 can be downloaded with our 3DPM v2 code here: 3DPMv2.1.rar (13.0 MB)
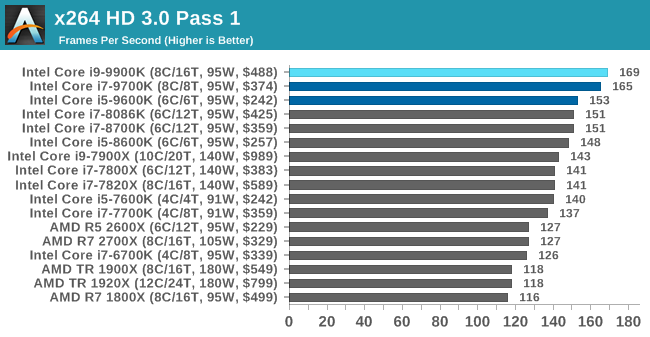
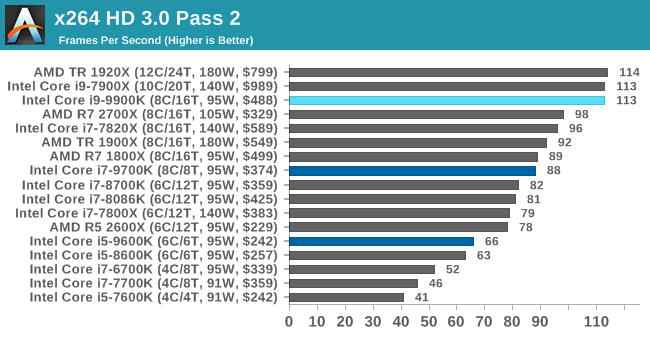
x264 HD 3.0: Older Transcode Test
This transcoding test is super old, and was used by Anand back in the day of Pentium 4 and Athlon II processors. Here a standardized 720p video is transcoded with a two-pass conversion, with the benchmark showing the frames-per-second of each pass. This benchmark is single-threaded, and between some micro-architectures we seem to actually hit an instructions-per-clock wall.


274 Comments
View All Comments
AutomaticTaco - Saturday, October 20, 2018 - link
Revised. TDP is still some generic average not true max. Regardless, not 220w.https://www.anandtech.com/show/13400/intel-9th-gen...
The motherboard in question was using an insane 1.47v
https://twitter.com/IanCutress/status/105342741705...
https://twitter.com/IanCutress/status/105339755111...
dezonio2 - Friday, October 19, 2018 - link
I would love to see overclocking performance of the 9600k. It would show exactly how much of a difference the upgraded TIM makes if compared to 8600k.emn13 - Friday, October 19, 2018 - link
That power consumption seems pretty crazy. Going from 4.5 to 5Gz for +56% powerdraw? or worse, from 5.0 to 5.3GHz for 6% clock boost and +40% powerdraw?This proc looks like it makes sense at 4.5GHz; beyond that - not much. I mean going from 4.5 to 5.3 isn't nothing - 18% more clocks! But that's going to translate into less-than-that performance gain, and even 18%, while admirable and all, is often not actually all that noticeable - unlike that powerdraw, which you'll likely notice in terms of noise and effort to get the system cooled at all.
I don't know; this proc looks... cool... but borderline. I'm not sure I'd buy it, even if money were no object (and since I'd consider this for work - it basically isn't).
Tkan2155 - Saturday, October 20, 2018 - link
Yes bill add up this prepare big wallet . amd can overclock higher but it's better at stock . intel is going over limit because they want to show the world they are the bestmapesdhs - Sunday, October 21, 2018 - link
But then, the candle that burns twice as brightly burns half as long. :)MonkeyPaw - Friday, October 19, 2018 - link
In regards to TDP, I say use your own methodology and ratings if Intel and AMD can’t arrive at a standard measure. Based on how the i9 truly performs in this regard, the 95W rating is just shy of disingenuous. When real world values are applied it does change where this CPU sits in regard to its overall value. Lots of performance? Yes, but it comes at a significant cost. These CPUs aren’t like GPUs, where the cooling solution is designed to match the limits of the GPU. No, Intel doesn’t even bundle a cooler, because they know they have nothing to offer to hit boost speeds, and let’s be real—it’s the boost speeds that help sell this product and yield bragging rights.pavag - Friday, October 19, 2018 - link
It doesn't have a price/performance chart, so it is hard to tell how justifiable is to spend on this processor, compared to alternatives, and that's the main purpose of reading this kind of articles.Here is one from TomsHardware, for reference:
https://img.purch.com/r/711x457/aHR0cDovL21lZGlhLm...
It makes clear that is little to gain from a cheap i5-8400 to an i9-9900K, and it also tells which processors are better performing at a given price, or cheaper at a given performance. At least from an average FPS gaming viewpoint.
WinterCharm - Friday, October 19, 2018 - link
Well written. Great article, and I enjoyed it thoroughly :)Machinus - Friday, October 19, 2018 - link
Can you test the power draw and temperatures of the 9900 with HT disabled, and compare that to the 9700 under the same conditions?Felice - Saturday, October 20, 2018 - link
Ryan--Any chance of you doing the same run with the 9900K's hyperthreading disabled? A lot of gamers find they get better performance without hyperthreading.