The Intel 9th Gen Review: Core i9-9900K, Core i7-9700K and Core i5-9600K Tested
by Ian Cutress on October 19, 2018 9:00 AM EST- Posted in
- CPUs
- Intel
- Coffee Lake
- 14++
- Core 9th Gen
- Core-S
- i9-9900K
- i7-9700K
- i5-9600K
CPU Performance: Rendering Tests
Rendering is often a key target for processor workloads, lending itself to a professional environment. It comes in different formats as well, from 3D rendering through rasterization, such as games, or by ray tracing, and invokes the ability of the software to manage meshes, textures, collisions, aliasing, physics (in animations), and discarding unnecessary work. Most renderers offer CPU code paths, while a few use GPUs and select environments use FPGAs or dedicated ASICs. For big studios however, CPUs are still the hardware of choice.
All of our benchmark results can also be found in our benchmark engine, Bench.
Corona 1.3: Performance Render
An advanced performance based renderer for software such as 3ds Max and Cinema 4D, the Corona benchmark renders a generated scene as a standard under its 1.3 software version. Normally the GUI implementation of the benchmark shows the scene being built, and allows the user to upload the result as a ‘time to complete’.
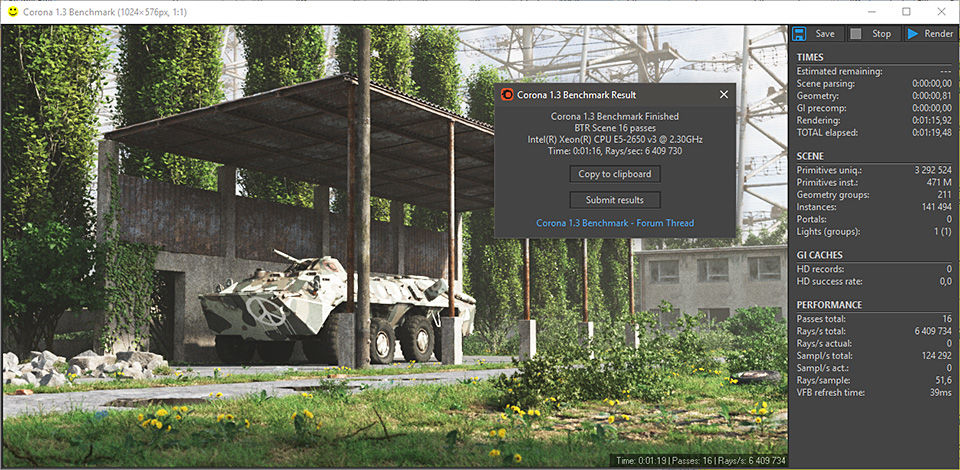
We got in contact with the developer who gave us a command line version of the benchmark that does a direct output of results. Rather than reporting time, we report the average number of rays per second across six runs, as the performance scaling of a result per unit time is typically visually easier to understand.
The Corona benchmark website can be found at https://corona-renderer.com/benchmark
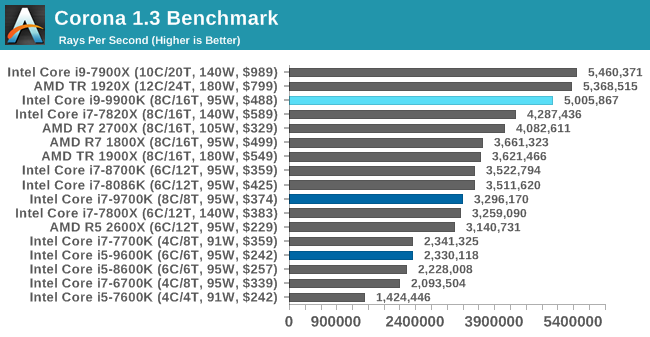
Corona is a fully multithreaded test, so the non-HT parts get a little behind here. The Core i9-9900K blasts through the AMD 8-core parts with a 25% margin, and taps on the door of the 12-core Threadripper.
Blender 2.79b: 3D Creation Suite
A high profile rendering tool, Blender is open-source allowing for massive amounts of configurability, and is used by a number of high-profile animation studios worldwide. The organization recently released a Blender benchmark package, a couple of weeks after we had narrowed our Blender test for our new suite, however their test can take over an hour. For our results, we run one of the sub-tests in that suite through the command line - a standard ‘bmw27’ scene in CPU only mode, and measure the time to complete the render.
Blender can be downloaded at https://www.blender.org/download/
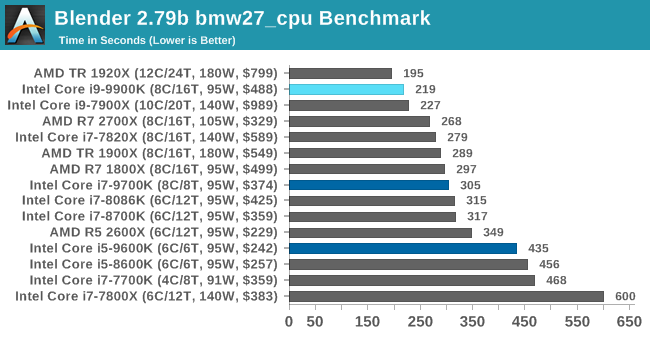
Blender has an eclectic mix of requirements, from memory bandwidth to raw performance, but like Corona the processors without HT get a bit behind here. The high frequency of the 9900K pushes it above the 10C Skylake-X part, and AMD's 2700X, but behind the 1920X.
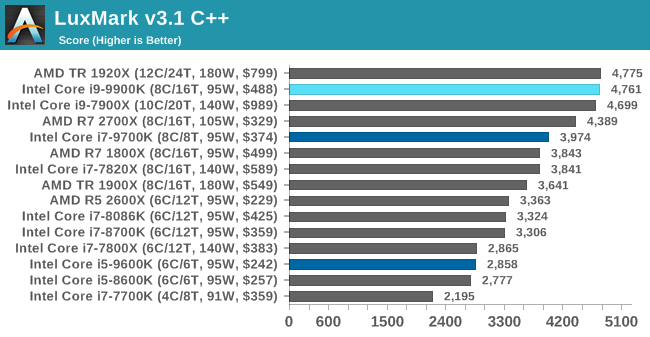
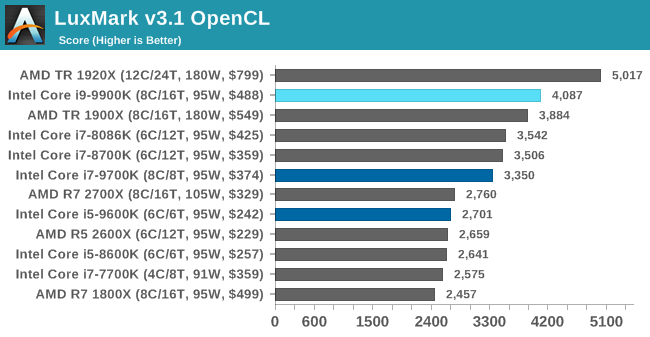
LuxMark v3.1: LuxRender via Different Code Paths
As stated at the top, there are many different ways to process rendering data: CPU, GPU, Accelerator, and others. On top of that, there are many frameworks and APIs in which to program, depending on how the software will be used. LuxMark, a benchmark developed using the LuxRender engine, offers several different scenes and APIs.
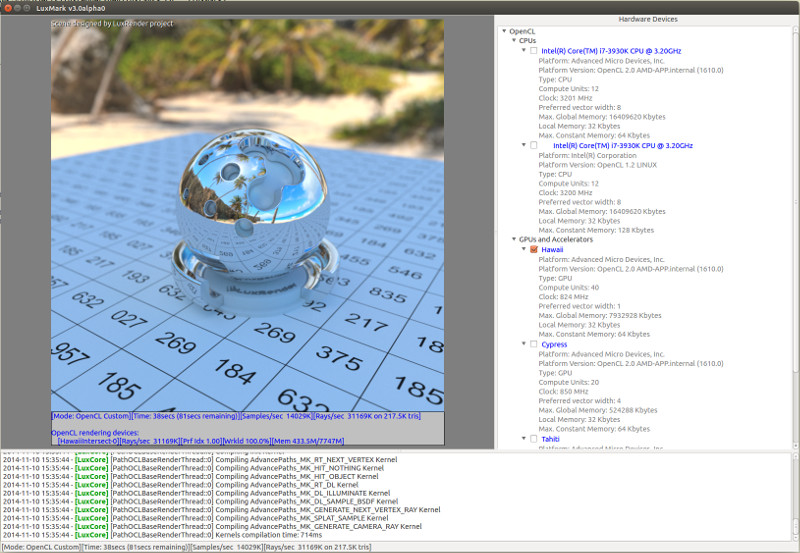
Taken from the Linux Version of LuxMark
In our test, we run the simple ‘Ball’ scene on both the C++ and OpenCL code paths, but in CPU mode. This scene starts with a rough render and slowly improves the quality over two minutes, giving a final result in what is essentially an average ‘kilorays per second’.
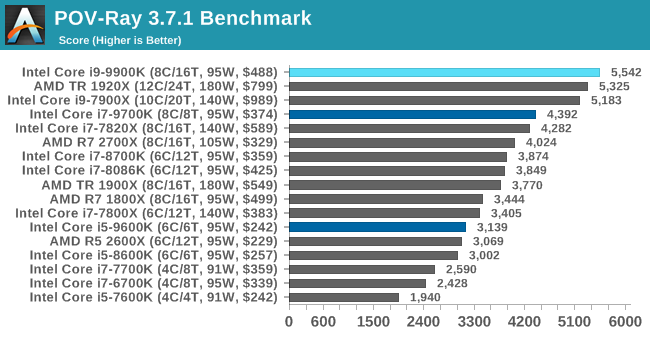
POV-Ray 3.7.1: Ray Tracing
The Persistence of Vision ray tracing engine is another well-known benchmarking tool, which was in a state of relative hibernation until AMD released its Zen processors, to which suddenly both Intel and AMD were submitting code to the main branch of the open source project. For our test, we use the built-in benchmark for all-cores, called from the command line.
POV-Ray can be downloaded from http://www.povray.org/


274 Comments
View All Comments
DominionSeraph - Sunday, October 21, 2018 - link
The 8700k is also pulling 150W while the 8086k is 95W. Something's not right there._mat - Wednesday, November 7, 2018 - link
There can be two reasons why that is the case:1) The mainboard settings for Power Limits were different.
2) The 8086K ran into Power Limit 1 while the 8700K was not.
Whatever is the case here, it is no doubt that the 8086K did run into Power Limit 1 after the "Time Above PL1" (= power budget) was depleted. The 95 Watts are exactly the specified TDP of the CPU and Intel recommends this as Power Limit 1 value.
So the problem here is that the Power Limits and Current Limits of the mainboard are not properly documented and seem to differ between the test candidates. While the 8086K obviously had Power Limits in place, the 9th gen CPUs were benched with no limits at all (only temperature limit at 100 °C on a core).
Also, the whole page on power consumption needs rework. The TDP does matter depending on the board and its default settings.
ballsystemlord - Sunday, October 21, 2018 - link
Ian! Many of your tests ( Y-Cruncher multithreaded, apptimer, FCAT - ROTR, WinRAR ), are taking too short of a time. You need some differentiation here! Please make them harder.R0H1T - Sunday, October 21, 2018 - link
>In case the previous comment was missed.I see that the last few pages have included a note about Z390 used because the Z370 board was over-volting the chip? Yet on the Overclocking page we see the Z370 listed with max CPU package power at 168 Watts? Could you list the (default) auto voltage applied by the Asrock Z370 & if appropriate update the charts on OCing page with the Z390 as well?
mapesdhs - Sunday, October 21, 2018 - link
"Intel has promised that its 10nm manufacturing process will ramp through 2019, ..."Ian, what promises did Intel make 2 years ago about what they would be supplying now?
eastcoast_pete - Sunday, October 21, 2018 - link
My guess is that Intel is now printing those promises in 10 nm font size (easily readable with a standard electron microscope). See, they moved to 10 nm by 2018!ballsystemlord - Sunday, October 21, 2018 - link
Actually, fonts are measured in points. So, it's 10pt, and it's rather legible.But, as for products, I don't see any either.
darkos - Sunday, October 21, 2018 - link
nice review, but: please add a flight simulation such as x-plane and prepar3d or fsx. this is an area that is sadly, missing from your reviews.kasboh - Monday, October 22, 2018 - link
Do I see it correctly that there is little benefit of HyperThreading with 8 core CPUs?eXterminuss - Monday, October 22, 2018 - link
I am quiet shocked to see that Anandtech is using a vastly outdated and in parts plainly wrong description for World of tanks:1. The enCore engine ist being used in world of tanks for quiet a while now (10 month)
2.World of tanks is a free to play game, no elements hiden behind a paywall, e. g. no more features for a paying customer than for a freelooter.
3. Since the outadted EnCore benchmark was used, i would have at least expected to see the Results of that benchmark being posted aswell.
Sincerly yours,
eXterminuss a World of Tanks Player