The Intel 9th Gen Review: Core i9-9900K, Core i7-9700K and Core i5-9600K Tested
by Ian Cutress on October 19, 2018 9:00 AM EST- Posted in
- CPUs
- Intel
- Coffee Lake
- 14++
- Core 9th Gen
- Core-S
- i9-9900K
- i7-9700K
- i5-9600K
CPU Performance: Web and Legacy Tests
While more the focus of low-end and small form factor systems, web-based benchmarks are notoriously difficult to standardize. Modern web browsers are frequently updated, with no recourse to disable those updates, and as such there is difficulty in keeping a common platform. The fast paced nature of browser development means that version numbers (and performance) can change from week to week. Despite this, web tests are often a good measure of user experience: a lot of what most office work is today revolves around web applications, particularly email and office apps, but also interfaces and development environments. Our web tests include some of the industry standard tests, as well as a few popular but older tests.
We have also included our legacy benchmarks in this section, representing a stack of older code for popular benchmarks.
All of our benchmark results can also be found in our benchmark engine, Bench.
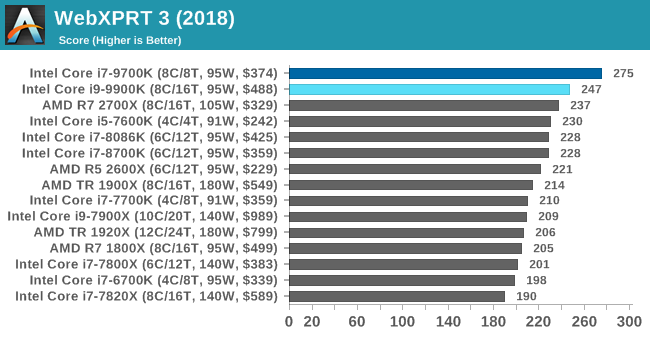
WebXPRT 3: Modern Real-World Web Tasks, including AI
The company behind the XPRT test suites, Principled Technologies, has recently released the latest web-test, and rather than attach a year to the name have just called it ‘3’. This latest test (as we started the suite) has built upon and developed the ethos of previous tests: user interaction, office compute, graph generation, list sorting, HTML5, image manipulation, and even goes as far as some AI testing.
For our benchmark, we run the standard test which goes through the benchmark list seven times and provides a final result. We run this standard test four times, and take an average.
Users can access the WebXPRT test at http://principledtechnologies.com/benchmarkxprt/webxprt/
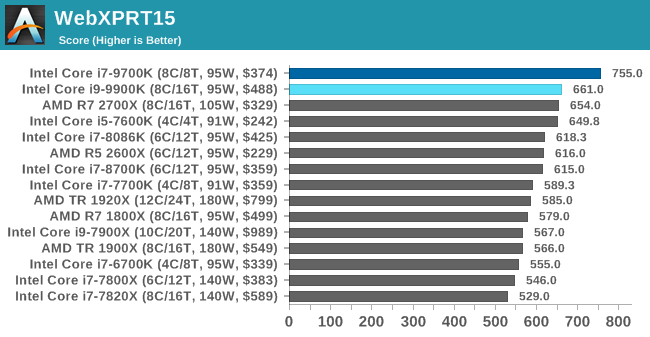
WebXPRT 2015: HTML5 and Javascript Web UX Testing
The older version of WebXPRT is the 2015 edition, which focuses on a slightly different set of web technologies and frameworks that are in use today. This is still a relevant test, especially for users interacting with not-the-latest web applications in the market, of which there are a lot. Web framework development is often very quick but with high turnover, meaning that frameworks are quickly developed, built-upon, used, and then developers move on to the next, and adjusting an application to a new framework is a difficult arduous task, especially with rapid development cycles. This leaves a lot of applications as ‘fixed-in-time’, and relevant to user experience for many years.
Similar to WebXPRT3, the main benchmark is a sectional run repeated seven times, with a final score. We repeat the whole thing four times, and average those final scores.
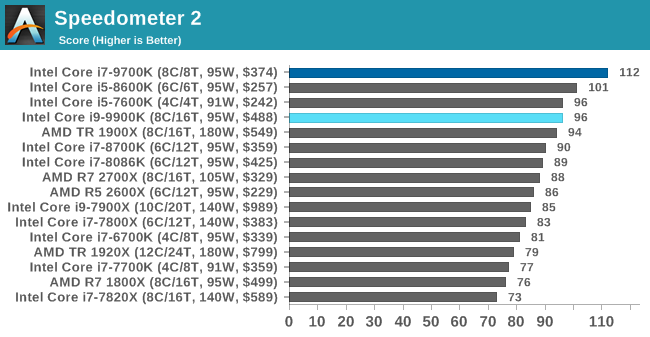
Speedometer 2: JavaScript Frameworks
Our newest web test is Speedometer 2, which is a accrued test over a series of javascript frameworks to do three simple things: built a list, enable each item in the list, and remove the list. All the frameworks implement the same visual cues, but obviously apply them from different coding angles.
Our test goes through the list of frameworks, and produces a final score indicative of ‘rpm’, one of the benchmarks internal metrics. We report this final score.
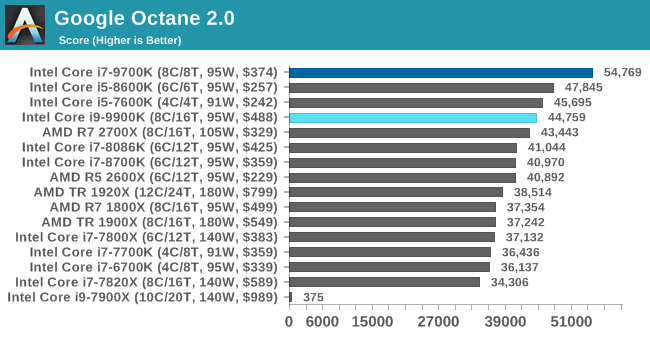
Google Octane 2.0: Core Web Compute
A popular web test for several years, but now no longer being updated, is Octane, developed by Google. Version 2.0 of the test performs the best part of two-dozen compute related tasks, such as regular expressions, cryptography, ray tracing, emulation, and Navier-Stokes physics calculations.
The test gives each sub-test a score and produces a geometric mean of the set as a final result. We run the full benchmark four times, and average the final results.
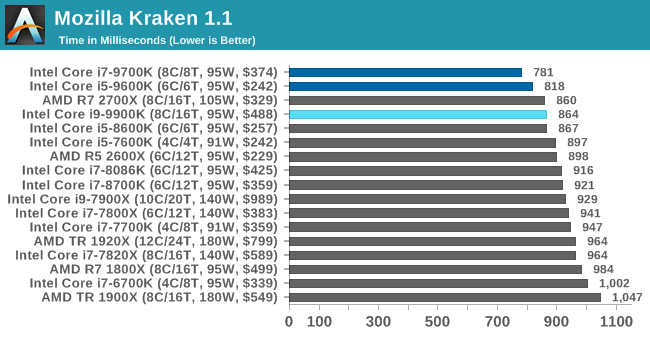
Mozilla Kraken 1.1: Core Web Compute
Even older than Octane is Kraken, this time developed by Mozilla. This is an older test that does similar computational mechanics, such as audio processing or image filtering. Kraken seems to produce a highly variable result depending on the browser version, as it is a test that is keenly optimized for.
The main benchmark runs through each of the sub-tests ten times and produces an average time to completion for each loop, given in milliseconds. We run the full benchmark four times and take an average of the time taken.
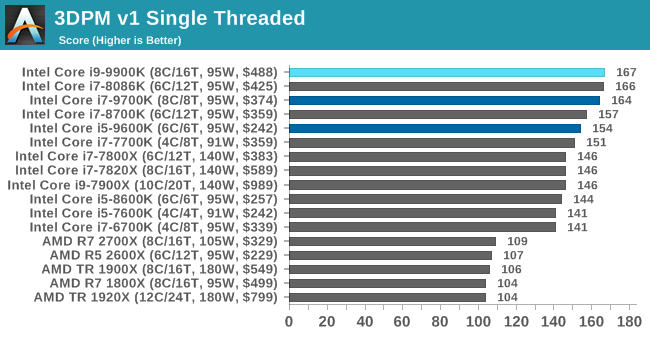
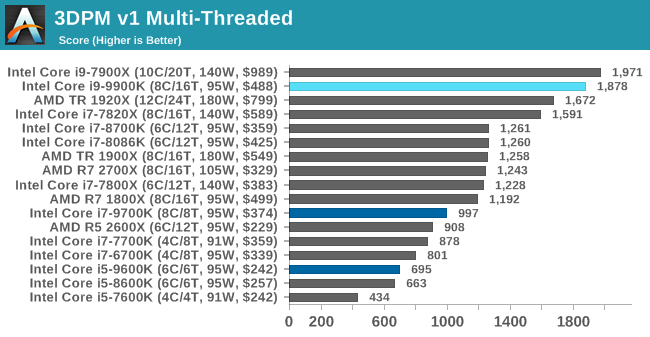
3DPM v1: Naïve Code Variant of 3DPM v2.1
The first legacy test in the suite is the first version of our 3DPM benchmark. This is the ultimate naïve version of the code, as if it was written by scientist with no knowledge of how computer hardware, compilers, or optimization works (which in fact, it was at the start). This represents a large body of scientific simulation out in the wild, where getting the answer is more important than it being fast (getting a result in 4 days is acceptable if it’s correct, rather than sending someone away for a year to learn to code and getting the result in 5 minutes).
In this version, the only real optimization was in the compiler flags (-O2, -fp:fast), compiling it in release mode, and enabling OpenMP in the main compute loops. The loops were not configured for function size, and one of the key slowdowns is false sharing in the cache. It also has long dependency chains based on the random number generation, which leads to relatively poor performance on specific compute microarchitectures.
3DPM v1 can be downloaded with our 3DPM v2 code here: 3DPMv2.1.rar (13.0 MB)
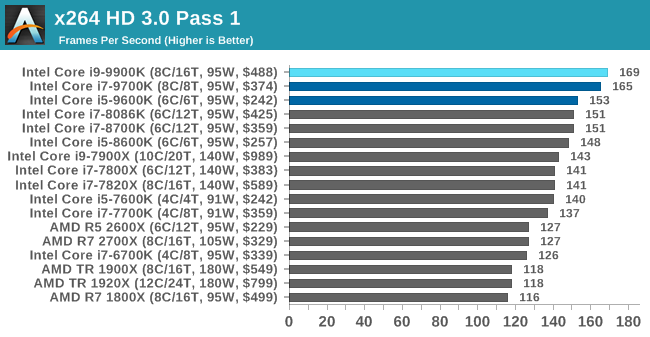
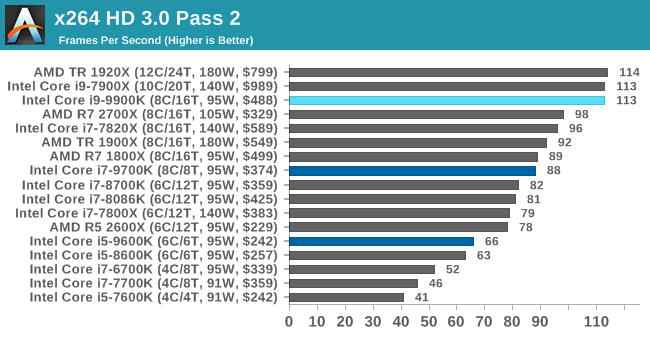
x264 HD 3.0: Older Transcode Test
This transcoding test is super old, and was used by Anand back in the day of Pentium 4 and Athlon II processors. Here a standardized 720p video is transcoded with a two-pass conversion, with the benchmark showing the frames-per-second of each pass. This benchmark is single-threaded, and between some micro-architectures we seem to actually hit an instructions-per-clock wall.


274 Comments
View All Comments
The Original Ralph - Saturday, October 20, 2018 - link
sorry, B&H's availability date should be JAN 1, 2100eastcoast_pete - Saturday, October 20, 2018 - link
JAN 1, 2100? Intel's manufacturing problems must be at lot more serious than we knew (:I wonder if the 9900K will be supported by "Windows 21" when they finally ship?
cubebomb - Saturday, October 20, 2018 - link
you guys need to stop posting 1080p benchmarks for games already. come on now.gammaray - Sunday, October 21, 2018 - link
I agree, 1440p and higher, especially with the top CPUsmapesdhs - Sunday, October 21, 2018 - link
They would of course respond that they have to show 1080p in order to reveal CPU differences, even if the frame rates are so high that most people wouldn't care anyway. I suppose those who do game at 1080p on high refresh monitors would say they care about the data, but then the foundation of the RTX launch is a new pressure to move away from high refresh rates, something the aforementioned group of gamers physically cannot do.piroroadkill - Monday, October 22, 2018 - link
They need to show a meaningful difference between CPUs. setting a higher resolution makes the tests worthless, as you'll just be GPU bottlenecked.eva02langley - Monday, October 22, 2018 - link
They are important since they bring in perspective CPU bottleneck, however it is widely overpreached.1080p, 1440p and 2160p at max settings... enough said. Without multiple resolutions benchmarks, it is impossible to get a clear picture of the real performances to expect from a potential system.
However, basically, a value rating system is now MANDATORY. It doesn't make any sense that the 9900k received 90% + score on Toms and WCCF. They offer abysmal value for gamers, so it is not "The Best Gaming CPU", however it is the "strongest"
DominionSeraph - Monday, October 22, 2018 - link
It's $110 over the i7. If you're looking at a $2500 i7 rig, going to $2610 with an i9 is a 4% increase in price. Looks to me like it generally wins by over 4%. That's a really good value for a content creator since it stomps the i7 by over 20%.Chestertonian - Wednesday, February 27, 2019 - link
No kidding. Why are there barely any 1440p benchmarks, but there are tons of 8k benchmarks? I don't get it.avatar-ds - Sunday, October 21, 2018 - link
Something's fishy with the 8086k consistently underperforming the 8700k in many (most?) gaming tests by more than a margin of error where differences are significant enough. Undermines credibility of the whole thing.