The Intel 9th Gen Review: Core i9-9900K, Core i7-9700K and Core i5-9600K Tested
by Ian Cutress on October 19, 2018 9:00 AM EST- Posted in
- CPUs
- Intel
- Coffee Lake
- 14++
- Core 9th Gen
- Core-S
- i9-9900K
- i7-9700K
- i5-9600K
CPU Performance: Rendering Tests
Rendering is often a key target for processor workloads, lending itself to a professional environment. It comes in different formats as well, from 3D rendering through rasterization, such as games, or by ray tracing, and invokes the ability of the software to manage meshes, textures, collisions, aliasing, physics (in animations), and discarding unnecessary work. Most renderers offer CPU code paths, while a few use GPUs and select environments use FPGAs or dedicated ASICs. For big studios however, CPUs are still the hardware of choice.
All of our benchmark results can also be found in our benchmark engine, Bench.
Corona 1.3: Performance Render
An advanced performance based renderer for software such as 3ds Max and Cinema 4D, the Corona benchmark renders a generated scene as a standard under its 1.3 software version. Normally the GUI implementation of the benchmark shows the scene being built, and allows the user to upload the result as a ‘time to complete’.
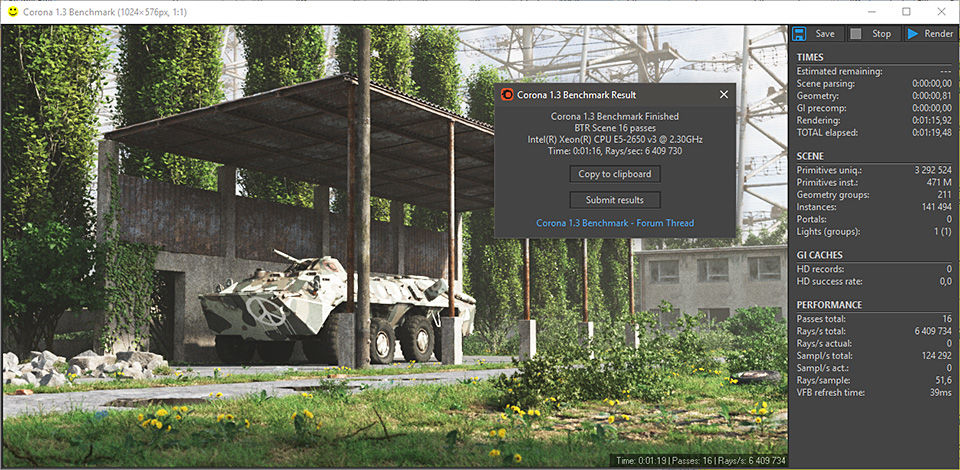
We got in contact with the developer who gave us a command line version of the benchmark that does a direct output of results. Rather than reporting time, we report the average number of rays per second across six runs, as the performance scaling of a result per unit time is typically visually easier to understand.
The Corona benchmark website can be found at https://corona-renderer.com/benchmark
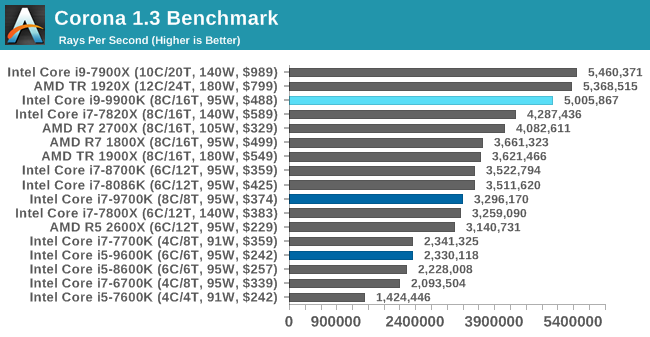
Corona is a fully multithreaded test, so the non-HT parts get a little behind here. The Core i9-9900K blasts through the AMD 8-core parts with a 25% margin, and taps on the door of the 12-core Threadripper.
Blender 2.79b: 3D Creation Suite
A high profile rendering tool, Blender is open-source allowing for massive amounts of configurability, and is used by a number of high-profile animation studios worldwide. The organization recently released a Blender benchmark package, a couple of weeks after we had narrowed our Blender test for our new suite, however their test can take over an hour. For our results, we run one of the sub-tests in that suite through the command line - a standard ‘bmw27’ scene in CPU only mode, and measure the time to complete the render.
Blender can be downloaded at https://www.blender.org/download/
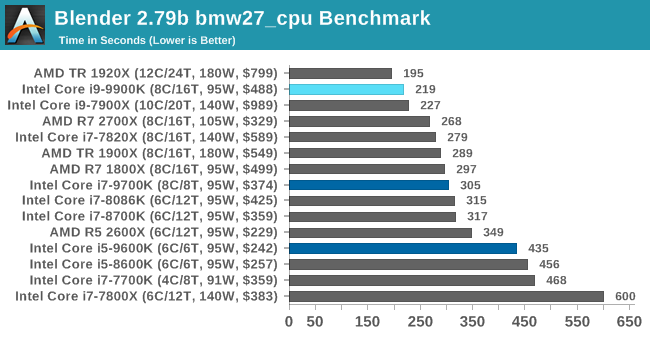
Blender has an eclectic mix of requirements, from memory bandwidth to raw performance, but like Corona the processors without HT get a bit behind here. The high frequency of the 9900K pushes it above the 10C Skylake-X part, and AMD's 2700X, but behind the 1920X.
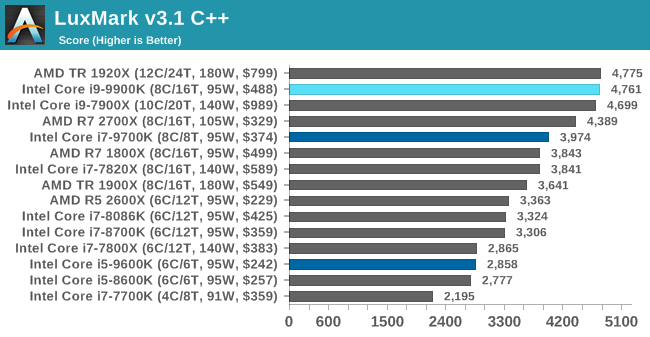
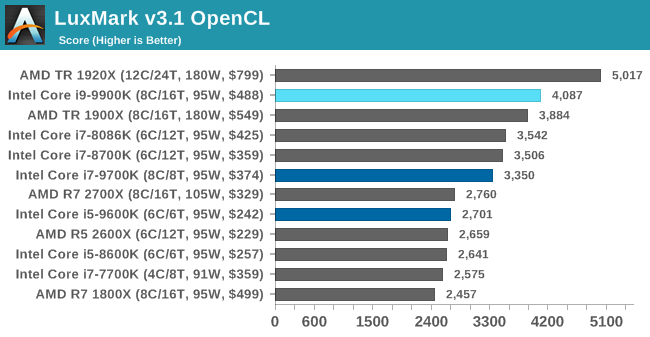
LuxMark v3.1: LuxRender via Different Code Paths
As stated at the top, there are many different ways to process rendering data: CPU, GPU, Accelerator, and others. On top of that, there are many frameworks and APIs in which to program, depending on how the software will be used. LuxMark, a benchmark developed using the LuxRender engine, offers several different scenes and APIs.
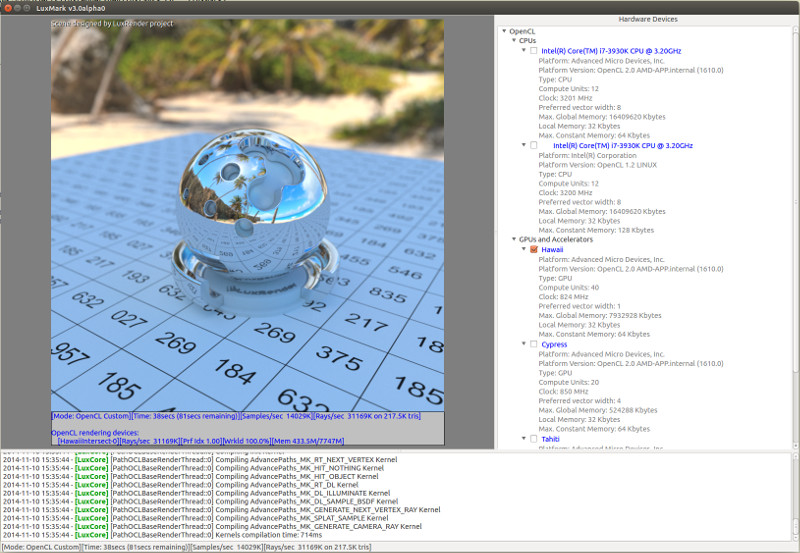
Taken from the Linux Version of LuxMark
In our test, we run the simple ‘Ball’ scene on both the C++ and OpenCL code paths, but in CPU mode. This scene starts with a rough render and slowly improves the quality over two minutes, giving a final result in what is essentially an average ‘kilorays per second’.
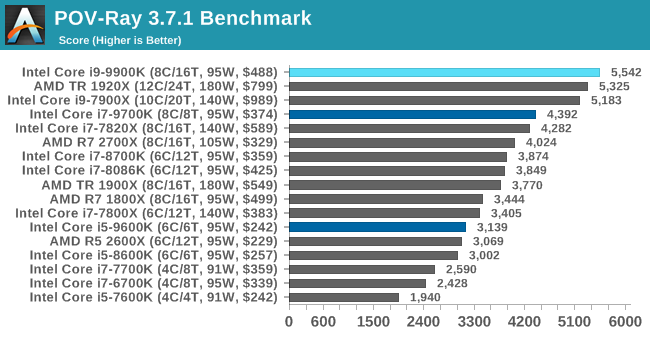
POV-Ray 3.7.1: Ray Tracing
The Persistence of Vision ray tracing engine is another well-known benchmarking tool, which was in a state of relative hibernation until AMD released its Zen processors, to which suddenly both Intel and AMD were submitting code to the main branch of the open source project. For our test, we use the built-in benchmark for all-cores, called from the command line.
POV-Ray can be downloaded from http://www.povray.org/


274 Comments
View All Comments
vext - Friday, October 19, 2018 - link
Very good article, but here are my beefs.Why is there no mention of temperatures?
According to Techspot the 9900k runs ridiculously hot under heavy loads. At stock clocks under a heavy Blender load it reaches 85C with a Corsair H100i Pro, or Noctua NH-D15. Pushed to 5Ghz, it hits 100C. At 5.1 Ghz it FAILS. I suggest that Anandtech has failed by not discussing this.
Techspot says:
"There’s simply no way you’re going to avoid thermal throttling without spending around $100 on the cooler, at least without your PC sounding like a jet about to take off. Throw in the Corsair H100i Pro and the 9900K now costs $700 and you still can’t overclock, at least not without running at dangerously high temperatures."
Why the focus on single threaded benchmarks? For the most part they are irrelevant. Yet they are posted in their own graph, at the front of each testing section, as though they were the most important data point. Just include them as a separate bar with the multi-thread benchmarks. Good Grief!
Why post MSRP prices in every single benchmark? You can't even buy them for MSRP. There should be a single chart at the front of the article with a rough retail estimate for each processor, and links to the retailers. If the MSRP is necessary, then just add a column to the chart. Sheesh.
Why no in depth cost/benefit comparison? A Ryzen 2600 with included cooler at $160 costs only one quarter of a 9900k with an aio cooler at $700. The $540 difference would buy a new RTX 2070 video card. Or three more Ryzen 2600's. For crying out loud.
I like the 9900k, it's a good processor. It's intended for hobbyists that can play with custom loop cooling. But it's not realistic for most people.
mapesdhs - Sunday, October 21, 2018 - link
All good questions... the silence is deafening. Thankfully, there's plenty of commentary on the value equation to be found. A small channel atm, but I like this guy's vids:https://www.youtube.com/watch?v=EWO5A9VMcyY
abufrejoval - Friday, October 19, 2018 - link
I needed something a little bigger for my lab two or three years ago and came across an E5-2696v3 on eBay from China, a Haswell generation 18-core at $700.That chips didn't officially exist, but after digging a little deeper I found it's basically an E5-2699v3 which clocks a little higher (3.8 instead of 3.6GHz) with 1-2 cores active. So it's basically a better chip for a fraction of the going price of the lesser one (E5-2699v3 is still listed at €4649 by my favorite e-tailer). And yes, it's a perfect chip, Prime95'd it for hours, POVrayd and Blendered for days until I was absolutely sure it was a prime quality chip.
Officially it has 145Watts TDP, but I've only ever seen it go to 110Watts on HWiNFO with Prime95 in its meanest settings: It must be a perfect bin. With the particle pusher it's never more than 93Watts while no part of the CPU exceeds 54°C with a Noctua 140mm fan practically inaudible at 1000rpm cooling it: That because the 18 cores and 36 threads never run faster than 2.8GHz fully loaded. They also don't drop below it (except for idle, 1.855 Watts minimum btw.), so you can pretty much forget about the 2.3GHz 'nominal' speed.
It gets 2968.245803 on that benchmark, slightly above the i9-9900k, somewhat below the ThreadRipper. That's 22nm Haswell against 14++/12nm current and 18 vs 8/12 cores.
This is rather typical for highly-threaded workloads: It's either cores or clocks and when the power ceiling is fixed you get higher throughput and energy efficiency when you can throw cores instead of clocks at the problem.
I think it's a data point worth highlighting in this crazy clock race somewhat reminiscent of Pentium 4 days, heat vs. efficiency, a four year old chip beating the newcomer in performance and almost 3:1 in efficiency at far too similar prices.
Yet, this specific chip will clock pretty high for a server chip, easily doing 3.6 GHz with eight cores seeing action from your game engine, while the remaining ten are often ignored: Perhaps that's a Ryzen effect, it used to be 4:14 earlier.
I've done BCLK overclock of 1.08 to have it reach the magic 4GHz at maximum turbo, but it's not noticeable in real-life neck-to-neck to an E3-1276v3 which also turbos to 4GHz on three cores out of four available, 3.9 at 4/4 with HT.
abufrejoval - Friday, October 19, 2018 - link
2968.245803 on the particle pusher benchmark... need editicoreaudience - Friday, October 19, 2018 - link
Move away from rar/lzma : the new darling of data compression is called Zstandard :https://www.zstd.net
It comes with a nice integrated benchmark, which can easily ramp up with multithreading :
zstd -b -1 -T8 fileToTest # benchmark level one on fileToTest using 8 threads
Windows user can even download a pre-compiled binary directly in the release notice :
https://github.com/facebook/zstd/releases/latest
It would be great to see some numbers using this compressor on latest Intel cores !
Kaihekoa - Friday, October 19, 2018 - link
Looks like all your gaming benchmarks are GPU bound and there pointless. Why not use a 2080 Ti to eliminate/reduce GPU bottleneck?Kaihekoa - Friday, October 19, 2018 - link
therefore*palladium - Friday, October 19, 2018 - link
Can you please run some SPEC2006 benchmarks and see if Apple's SOC really has caught on to Intel's performance (per core), as mentioned in Andrei in his iPhone XS review? ThanksVirpZ - Friday, October 19, 2018 - link
Apart from blender, your review is full Intel biased software for rendering.Hifihedgehog - Friday, October 19, 2018 - link
Hey Ian. I see your updated full load power consumptions results. Question: Why is it that the six-core i7-8086K is drawing so little power in comparison to everything else including the quad-cores? Is this due to its better binning or is this simply an error that crept in?