Marrying Vega and Zen: The AMD Ryzen 5 2400G Review
by Ian Cutress on February 12, 2018 9:00 AM ESTBenchmarking Performance: CPU Legacy Tests
Our legacy tests represent benchmarks that were once at the height of their time. Some of these are industry standard synthetics, and we have data going back over 10 years. All of the data here has been rerun on Windows 10, and we plan to go back several generations of components to see how performance has evolved.
All of our benchmark results can also be found in our benchmark engine, Bench.
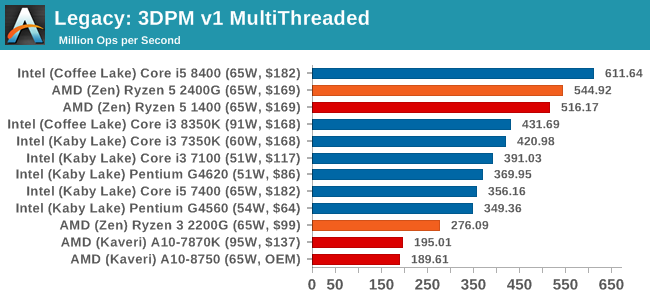
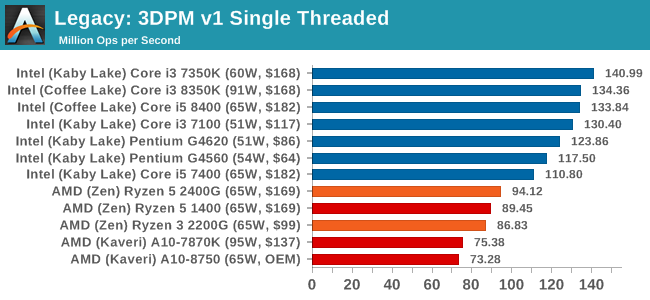
3D Particle Movement v1
3DPM is a self-penned benchmark, taking basic 3D movement algorithms used in Brownian Motion simulations and testing them for speed. High floating point performance, MHz and IPC wins in the single thread version, whereas the multithread version has to handle the threads and loves more cores. This is the original version, written in the style of a typical non-computer science student coding up an algorithm for their theoretical problem, and comes without any non-obvious optimizations not already performed by the compiler, such as false sharing.
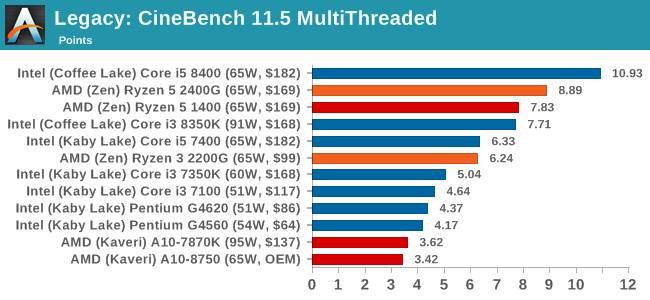
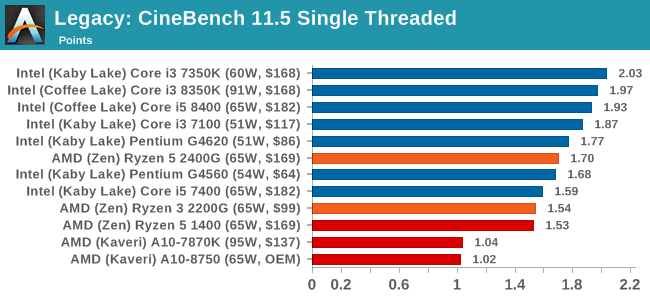
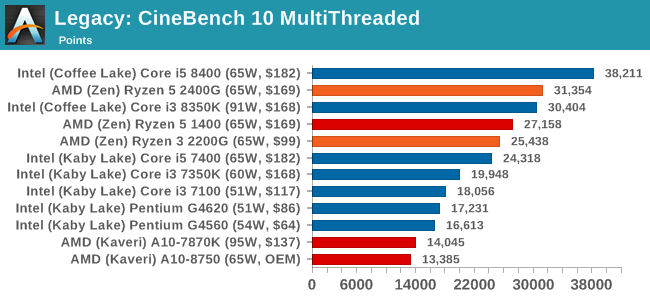
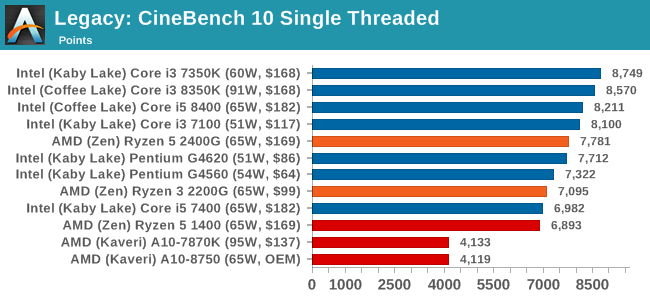
CineBench 11.5 and 10
Cinebench is a widely known benchmarking tool for measuring performance relative to MAXON's animation software Cinema 4D. Cinebench has been optimized over a decade and focuses on purely CPU horsepower, meaning if there is a discrepancy in pure throughput characteristics, Cinebench is likely to show that discrepancy. Arguably other software doesn't make use of all the tools available, so the real world relevance might purely be academic, but given our large database of data for Cinebench it seems difficult to ignore a small five minute test. We run the modern version 15 in this test, as well as the older 11.5 and 10 due to our back data.
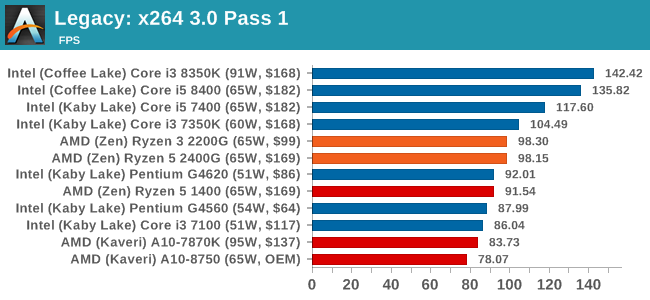
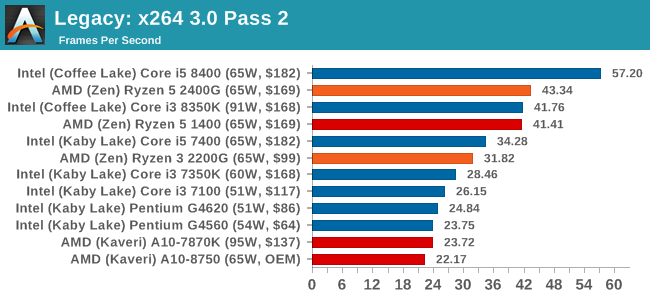
x264 HD 3.0
Similarly, the x264 HD 3.0 package we use here is also kept for historic regressional data. The latest version is 5.0.1, and encodes a 1080p video clip into a high quality x264 file. Version 3.0 only performs the same test on a 720p file, and in most circumstances the software performance hits its limit on high end processors, but still works well for mainstream and low-end. Also, this version only takes a few minutes, whereas the latest can take over 90 minutes to run.


177 Comments
View All Comments
jjj - Monday, February 12, 2018 - link
Playable means 30FPS and has been that for.. ever.AndrewJacksonZA - Monday, February 12, 2018 - link
Typo page 1: "Fast forward almost two years, to the start of 2018. Intel did have a second generation eDRAM product"The linked article is from 2 May 2016, not the start of 2018.
richardginn - Monday, February 12, 2018 - link
If only the ram used in the 2400G review kits was not so god damn expensive. It is more expensive than the CPU.Ian Cutress - Monday, February 12, 2018 - link
This is true - technically we were sampled a different DDR4-3200 kit to be used. Normally our policy here is to use the maximum supported DRAM frequency of the processor for these tests - in the past there is a war of words when reviews do not, from readers and companies. When we do our memory scaling piece, it'll be with a wide range of offerings.richardginn - Monday, February 12, 2018 - link
I certainly want to see the memory scaling piece before making a purchase.RBD117 - Monday, February 12, 2018 - link
Hey Ian, thanks for the great review. I think your Cinebench-1T scores should be higher, in the 151-160 range for the 2200G and 2400G respectively. AMD pushed a microcode update through BIOS to testers very very late last week. A lot of the changes significantly boosted single-thread performance in general, even in some games. Did you folks end up getting this?Ian Cutress - Monday, February 12, 2018 - link
I only started testing with the new BIOS: can you confirm the difference is on both the motherboards AMD sampled? Some got MSI, others got GIGABYTE. We had MSI.RBD117 - Monday, February 12, 2018 - link
Ah okay. I believe it should have been updated on both MSI and Gigabyte...at least, I was told it should have landed on both platforms for standardization.jrs77 - Monday, February 12, 2018 - link
I would've loved to see you compare the 2400G against the i7-5775C with regards to 1080p gaming, as I can play games like Borderlands, WoW or Diablo in 1080p with medium settings on my Broadwell Iris graphics just fine.If the 2400G doesn't allow for higher graphics settings than the i7-5775C, than I don't really see them taking the crown for integrated graphics. intel is just too stoopid to use what they have it seems.
nierd - Monday, February 12, 2018 - link
When that i7 cost less than 150 then it will make the chart. At the price point it's at I can buy one of these chips and a $200 graphics card and do laps around the i7 all day.