The AMD Ryzen Threadripper 1950X and 1920X Review: CPUs on Steroids
by Ian Cutress on August 10, 2017 9:00 AM ESTCPU Legacy Tests
Our legacy tests represent benchmarks that were once at the height of their time. Some of these are industry standard synthetics, and we have data going back over 10 years. All of the data here has been rerun on Windows 10, and we plan to go back several generations of components to see how performance has evolved.
All of our benchmark results can also be found in our benchmark engine, Bench.
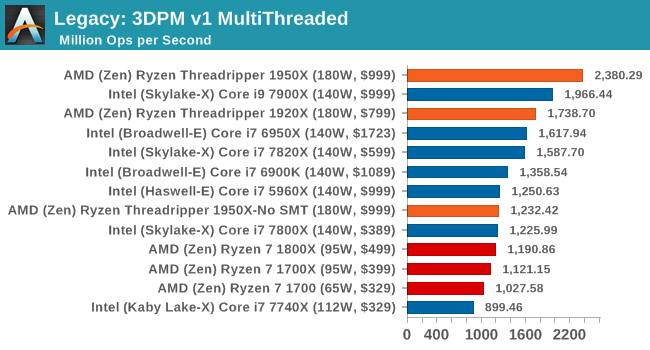
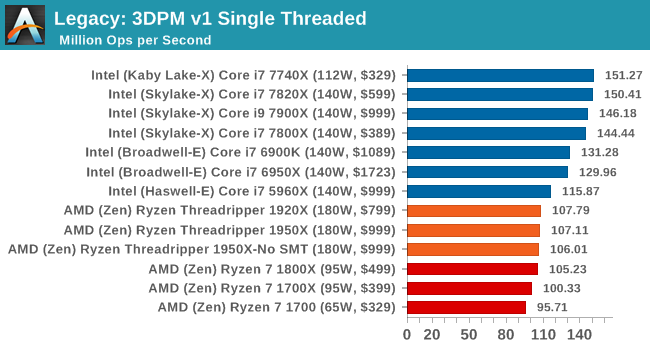
3D Particle Movement v1
3DPM is a self-penned benchmark, taking basic 3D movement algorithms used in Brownian Motion simulations and testing them for speed. High floating point performance, MHz and IPC wins in the single thread version, whereas the multithread version has to handle the threads and loves more cores. This is the original version, written in the style of a typical non-computer science student coding up an algorithm for their theoretical problem, and comes without any non-obvious optimizations not already performed by the compiler, such as false sharing.
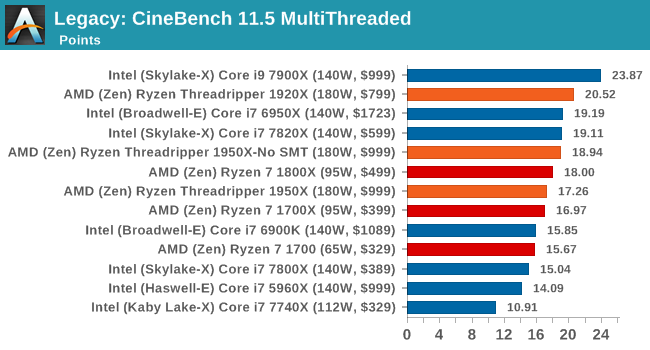
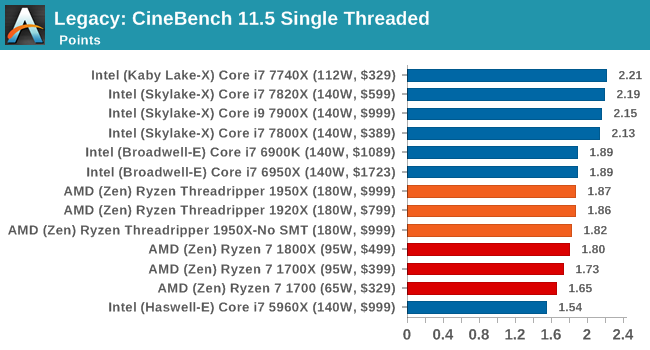
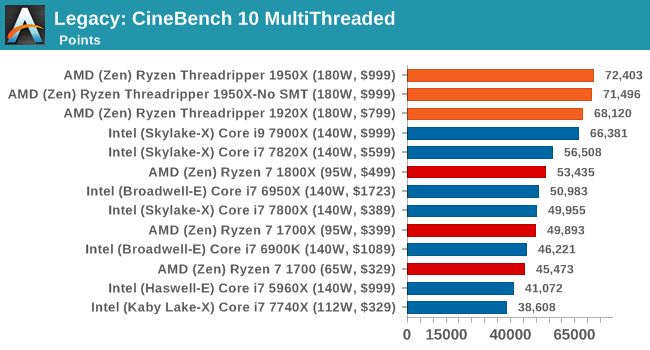
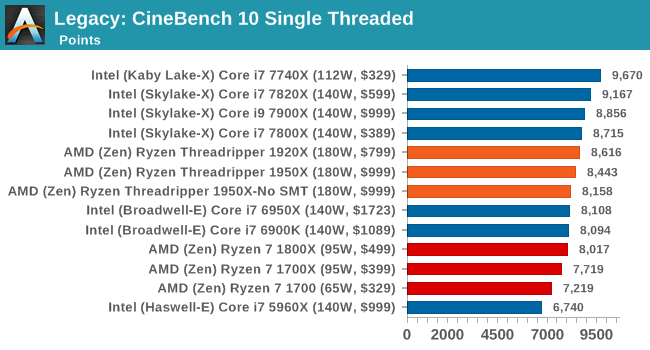
CineBench 11.5 and 10
Cinebench is a widely known benchmarking tool for measuring performance relative to MAXON's animation software Cinema 4D. Cinebench has been optimized over a decade and focuses on purely CPU horsepower, meaning if there is a discrepancy in pure throughput characteristics, Cinebench is likely to show that discrepancy. Arguably other software doesn't make use of all the tools available, so the real world relevance might purely be academic, but given our large database of data for Cinebench it seems difficult to ignore a small five minute test. We run the modern version 15 in this test, as well as the older 11.5 and 10 due to our back data.
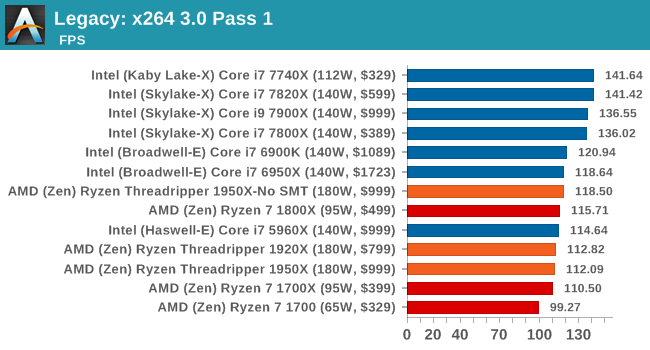
x264 HD 3.0
Similarly, the x264 HD 3.0 package we use here is also kept for historic regressional data. The latest version is 5.0.1, and encodes a 1080p video clip into a high-quality x264 file. Version 3.0 only performs the same test on a 720p file, and in most circumstances the software performance hits its limit on high-end processors, but still works well for mainstream and low-end. Also, this version only takes a few minutes, whereas the latest can take over 90 minutes to run.
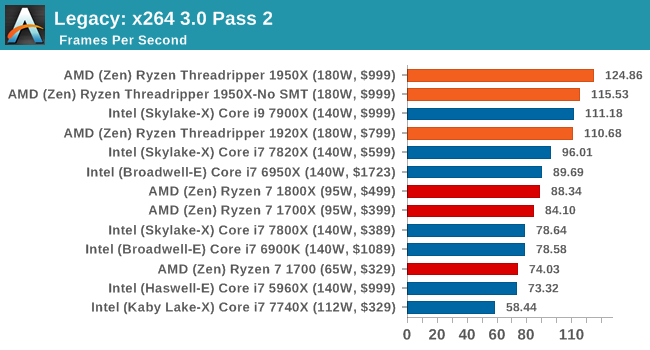
The 1950X: the first CPU to score higher on the 2nd pass of this test than it does on the first pass.


347 Comments
View All Comments
blublub - Sunday, August 13, 2017 - link
From what I have read is that all TR do 3.9hhz and some even 4-4.1ghz on all cores .What are your temp when running all 10c @4.6ghz prime for 1-2hrs
Zingam - Sunday, August 13, 2017 - link
Ian, how about testing mobile CPUs - for games and for office work. Aren't mobile CPUs selling much larger numbers thatn desktop ones these days?I can't find a single benchmark comparing i5-7300hq vs i7-7700hq vs i7-7700K showing the difference in productivity workloads and not just for rendering pretty pictures but also for more specific tasks as compiling software etc.
I also would like to see some sort of comparison of new generation to all generations upto 10 years back in time. I'd like to know how much did performance increase since the age of Nehelem. At least from now on there should be a single test to display the relative performance increase over the last few generations. The average user doesn't upgrade their PC every year. The average user maybe upgrades every 5 years and it is really difficult to find out how much peformance increase would one get with an upgrade.
SanX - Sunday, August 13, 2017 - link
I agree, there must be 5-7 years old processors in the chartsSanX - Sunday, August 13, 2017 - link
Why one core of Apple A10 costs $10 but one core of Intel 7900x costs 10x more?oranos - Sunday, August 13, 2017 - link
so its complete dogsh*t for the segment which is driving the PC market right now: gaming. got it.ballsystemlord - Sunday, August 13, 2017 - link
Hey Ian, you've been talking about anandtech's great database where we can see all the cool info. Well, according to your database the Phenom II 6 core 1090T is equally powerful when compared to the 16 core threadripper!!!!!!! http://www.anandtech.com/bench/product/1932?vs=146With those sorts of numbers why would anyone plan an upgrade?
(And there is also only one metric displayed, strange!)
Not to play the Intel card on you as others do, but this is a serious problem for at least the AMD lineup of processors.
jmelgaard - Monday, August 14, 2017 - link
o.O... I don't know how you derived that conclusion? you need a guide on how to read the database?...BurntMyBacon - Monday, August 14, 2017 - link
For anyone looking for an overall fps for two pass encoding here is your equation (hope my math is correct):FPS = 2*FPS1*FPS2/(FPS2+FPS1)
No, you can't just average the FPS scores from each pass as the processor will spend more time in the slower pass.
For the x264 encoding test, for example, a few relevant FPS scores end up being:
i9-7900X: 122.56
i7-7820X: 114.37
i7-6900K: 95.26
i7-7740X: 82.74
TR-1950X: 118.13
TR-1950X(g): 117.00
TR-1920X: 111.74
R7-1800X: 100.19
Since two pass encoding requires both passes to be usable, getting an overall FPS score seems somewhat relevant. Alternately, using time to completion is would present the same information in a different manner. Though, it would be difficult to extrapolate performance results to estimate performance in other encodes without also posting the number of frames encoded.
goldgrenade - Thursday, January 4, 2018 - link
Take all those Intel FPS performance counters and multiply them by .7 and you have what their chips actually run at without a major security flaw in them.Let's see that would be...
i9-7900X: 85.792
i7-7820X: 80.059
i7-6900K: 66.682
i7-7740X: 57.918
And that's at best. It can be up to 50% degradation when rendering or having to do many small file accesses or repeated operations with KAISER.
Gastec - Tuesday, August 15, 2017 - link
I've having a hard time trying to swallow "Threadripper is a consumer focused product" line considering the prices to "consume" it: $550 for the MB, $550 for the TR1900X ($800 or $1000 for the others is just dreaming) then the RAM. The MB(at least the Asus one) should be $200 less, but I get it, they are trying to squeeze as much as possible from the...consumers. Now don't get me wrong and I mean no offence for the rich ones among you, but those CPU are for Workstations. WORK, not gamestations. Meaning you would need them to help you make your money, faster.