The Intel Broadwell Desktop Review: Core i7-5775C and Core i5-5675C Tested (Part 1)
by Ian Cutress on June 2, 2015 7:45 AM ESTOffice Performance
The dynamics of CPU Turbo modes, both Intel and AMD, can add a wrinkle to testing in environments with a variable threaded workload. There is also an added issue of the motherboard remaining consistent, depending on how the motherboard manufacturer wants to add in their own boosting technologies over the ones that Intel would prefer they used. In order to remain consistent, we implement an OS-level unique high performance mode on all the CPUs we test which should override any motherboard manufacturer performance mode.
All of our benchmark results can also be found in our benchmark engine, Bench.
Dolphin Benchmark: link
Many emulators are often bound by single-threaded CPU performance, and general reports tended to suggest that Haswell provided a significant boost to emulator performance. This benchmark runs a Wii program that raytraces a complex 3D scene inside the Dolphin Wii emulator. Performance on this benchmark is a good proxy of the speed of Dolphin CPU emulation, which is an intensive single core task using most aspects of a CPU. Results are given in minutes, where the Wii itself scores 17.53 minutes.
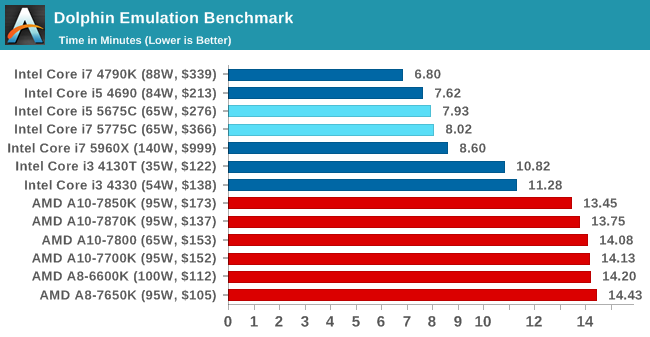
Crystal Well doesn’t help much in Dolphin, indicating it is more CPU frequency limited than DRAM/cache limited.
WinRAR 5.0.1: link
Our WinRAR test from 2013 is updated to the latest version of WinRAR at the start of 2014. We compress a set of 2867 files across 320 folders totaling 1.52 GB in size – 95% of these files are small typical website files, and the rest (90% of the size) are small 30 second 720p videos.
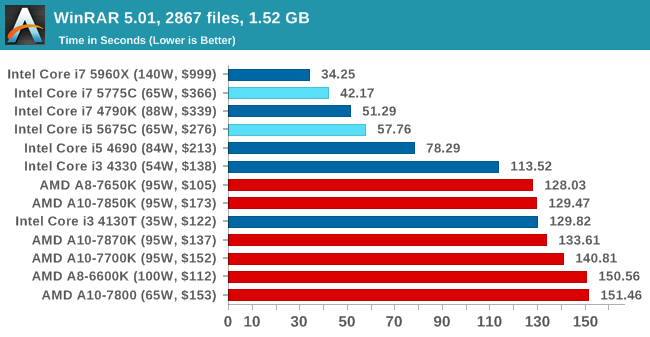
WinRAR is our typical benchmark to go to when testing whether DRAM is factor, and the improvements provided by the Crystal Well implementation trump any frequency deficit.
3D Particle Movement
3DPM is a self-penned benchmark, taking basic 3D movement algorithms used in Brownian Motion simulations and testing them for speed. High floating point performance, MHz and IPC wins in the single thread version, whereas the multithread version has to handle the threads and loves more cores.
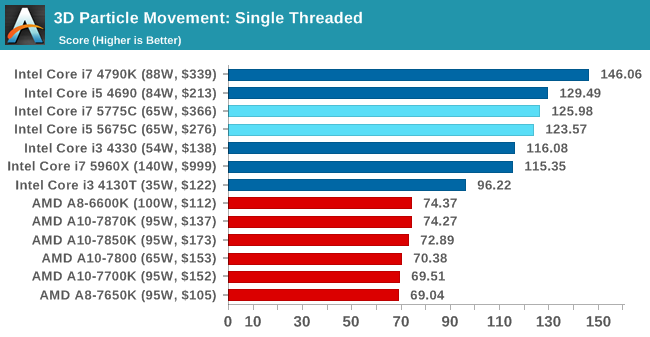
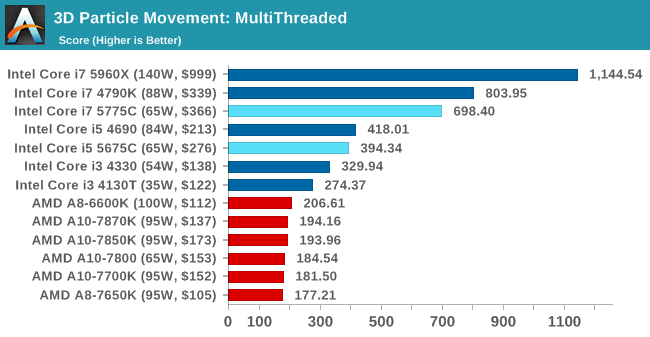
3DPM, like Dolphin, is concerned more with CPU frequency than DRAM accesses.
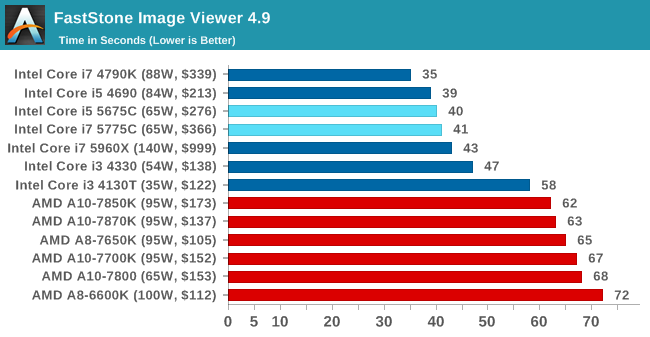
FastStone Image Viewer 4.9
FastStone is the program I use to perform quick or bulk actions on images, such as resizing, adjusting for color and cropping. In our test we take a series of 170 images in various sizes and formats and convert them all into 640x480 .gif files, maintaining the aspect ratio. FastStone does not use multithreading for this test, and results are given in seconds.
Web Benchmarks
On the lower end processors, general usability is a big factor of experience, especially as we move into the HTML5 era of web browsing. For our web benchmarks, we take four well known tests with Chrome 35 as a consistent browser.
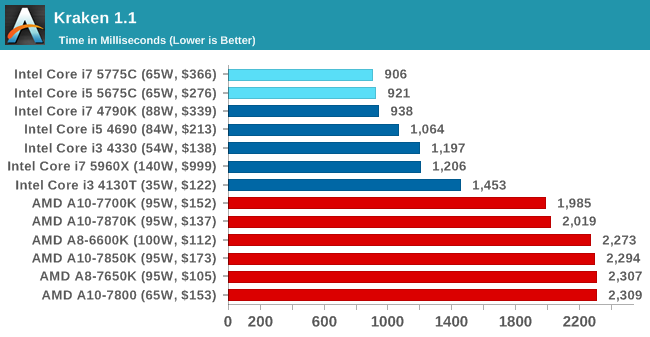
Mozilla Kraken 1.1
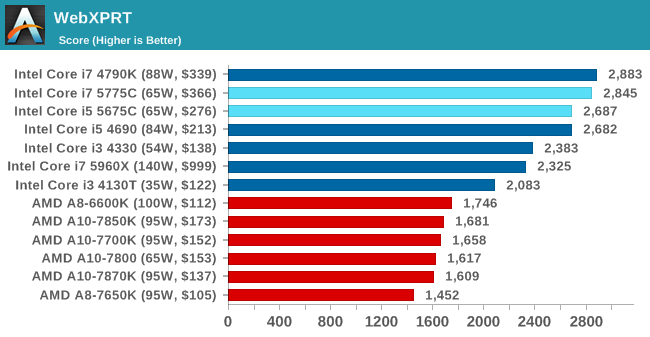
WebXPRT
Google Octane v2
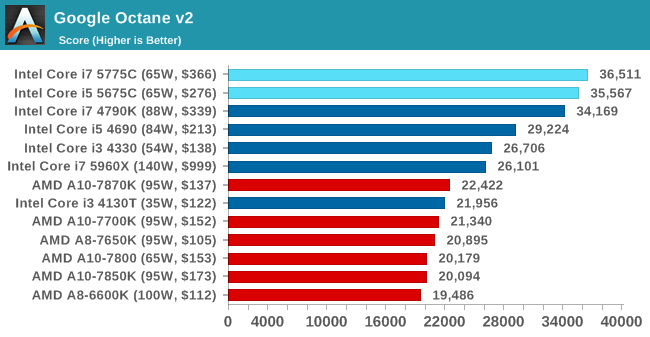
In the webtests, the Broadwell-DT CPUs didn’t necessarily take top spot but they are punching above their expected weight for their frequency.


196 Comments
View All Comments
Pcorb - Tuesday, June 2, 2015 - link
I'm not so sure that high end desktop users are a large enough demographic that Intel will be complaining any time soon.yannigr2 - Wednesday, June 3, 2015 - link
Yes I am shouting that for a month now, but of course I was treated as an AMD brainless fanboy when pointing at that, so I must be wrong. Now we have a chart that it is misleading and hilarious at the same time. If Ian had done what is right and logical, those charts would have been informative, correct and fair. I think AMD created 7870K just to troll Ian's charts.Hulk - Tuesday, June 2, 2015 - link
It would be really nice if you would note the frequency each processor is running during each test. With all the turbos these days it's hard to know and therefore hard to make IPC comparisons.Mr Perfect - Tuesday, June 2, 2015 - link
Yes, please. Once upon a time, I would have had the clocks for all the models memorized, but without that comparing IPC is difficult to impossible without the clocks noted.MrSpadge - Tuesday, June 2, 2015 - link
+1Lonyo - Tuesday, June 2, 2015 - link
You state in the opening that if you upgrade on a 3 year cycle, you would be coming from SandyBridge. Would it not make sense to have some older Intel processors in the graphs?Ian Cutress - Tuesday, June 2, 2015 - link
With a recent new testing suite, we haven't gone back through enough generations yet with the new benchmarking scheme. You can still check legacy benchmarks (Cinebench 10 / POV-Ray) between old and new in Bench. www.anandtech.com/benchHulk - Tuesday, June 2, 2015 - link
Yes. One thing Anand did amazingly well was review the new Intel processors. Clock-normalized IPC comparisons from previous generations is really what we want to see. As well as normalized power consumption, ie energy used completing the same workload.mgilbert - Tuesday, June 2, 2015 - link
As a normal home PC user/gamer, I couldn't care less about small differences in power consumption. Sure, 100 Watts might matter, but what matters most to me is outright performance.Martin84a - Tuesday, June 2, 2015 - link
As a normal PC user/gamer, that's all I care about. Less heat and thus less noise. Having a passively cooled PC that never goes above 65C under load is pure bliss.