The Crucial/Micron M500 Review (960GB, 480GB, 240GB, 120GB)
by Anand Lal Shimpi on April 9, 2013 9:59 AM ESTPerformance Consistency
In our Intel SSD DC S3700 review I introduced a new method of characterizing performance: looking at the latency of individual operations over time. The S3700 promised a level of performance consistency that was unmatched in the industry, and as a result needed some additional testing to show that. The reason we don't have consistent IO latency with SSDs is because inevitably all controllers have to do some amount of defragmentation or garbage collection in order to continue operating at high speeds. When and how an SSD decides to run its defrag and cleanup routines directly impacts the user experience. Frequent (borderline aggressive) cleanup generally results in more stable performance, while delaying that can result in higher peak performance at the expense of much lower worst case performance. The graphs below tell us a lot about the architecture of these SSDs and how they handle internal defragmentation.
To generate the data below I took a freshly secure erased SSD and filled it with sequential data. This ensures that all user accessible LBAs have data associated with them. Next I kicked off a 4KB random write workload across all LBAs at a queue depth of 32 using incompressible data. I ran the test for just over half an hour, no where near what we run our steady state tests for but enough to give me a good look at drive behavior once all spare area filled up.
I recorded instantaneous IOPS every second for the duration of the test. I then plotted IOPS vs. time and generated the scatter plots below. Each set of graphs features the same scale. The first two sets use a log scale for easy comparison, while the last set of graphs uses a linear scale that tops out at 40K IOPS for better visualization of differences between drives.
The high level testing methodology remains unchanged from our S3700 review. Unlike in previous reviews however, I did vary the percentage of the drive that I filled/tested depending on the amount of spare area I was trying to simulate. The buttons are labeled with the advertised user capacity had the SSD vendor decided to use that specific amount of spare area. If you want to replicate this on your own all you need to do is create a partition smaller than the total capacity of the drive and leave the remaining space unused to simulate a larger amount of spare area. The partitioning step isn't absolutely necessary in every case but it's an easy way to make sure you never exceed your allocated spare area. It's a good idea to do this from the start (e.g. secure erase, partition, then install Windows), but if you are working backwards you can always create the spare area partition, format it to TRIM it, then delete the partition. Finally, this method of creating spare area works on the drives we've tested here but not all controllers may behave the same way.
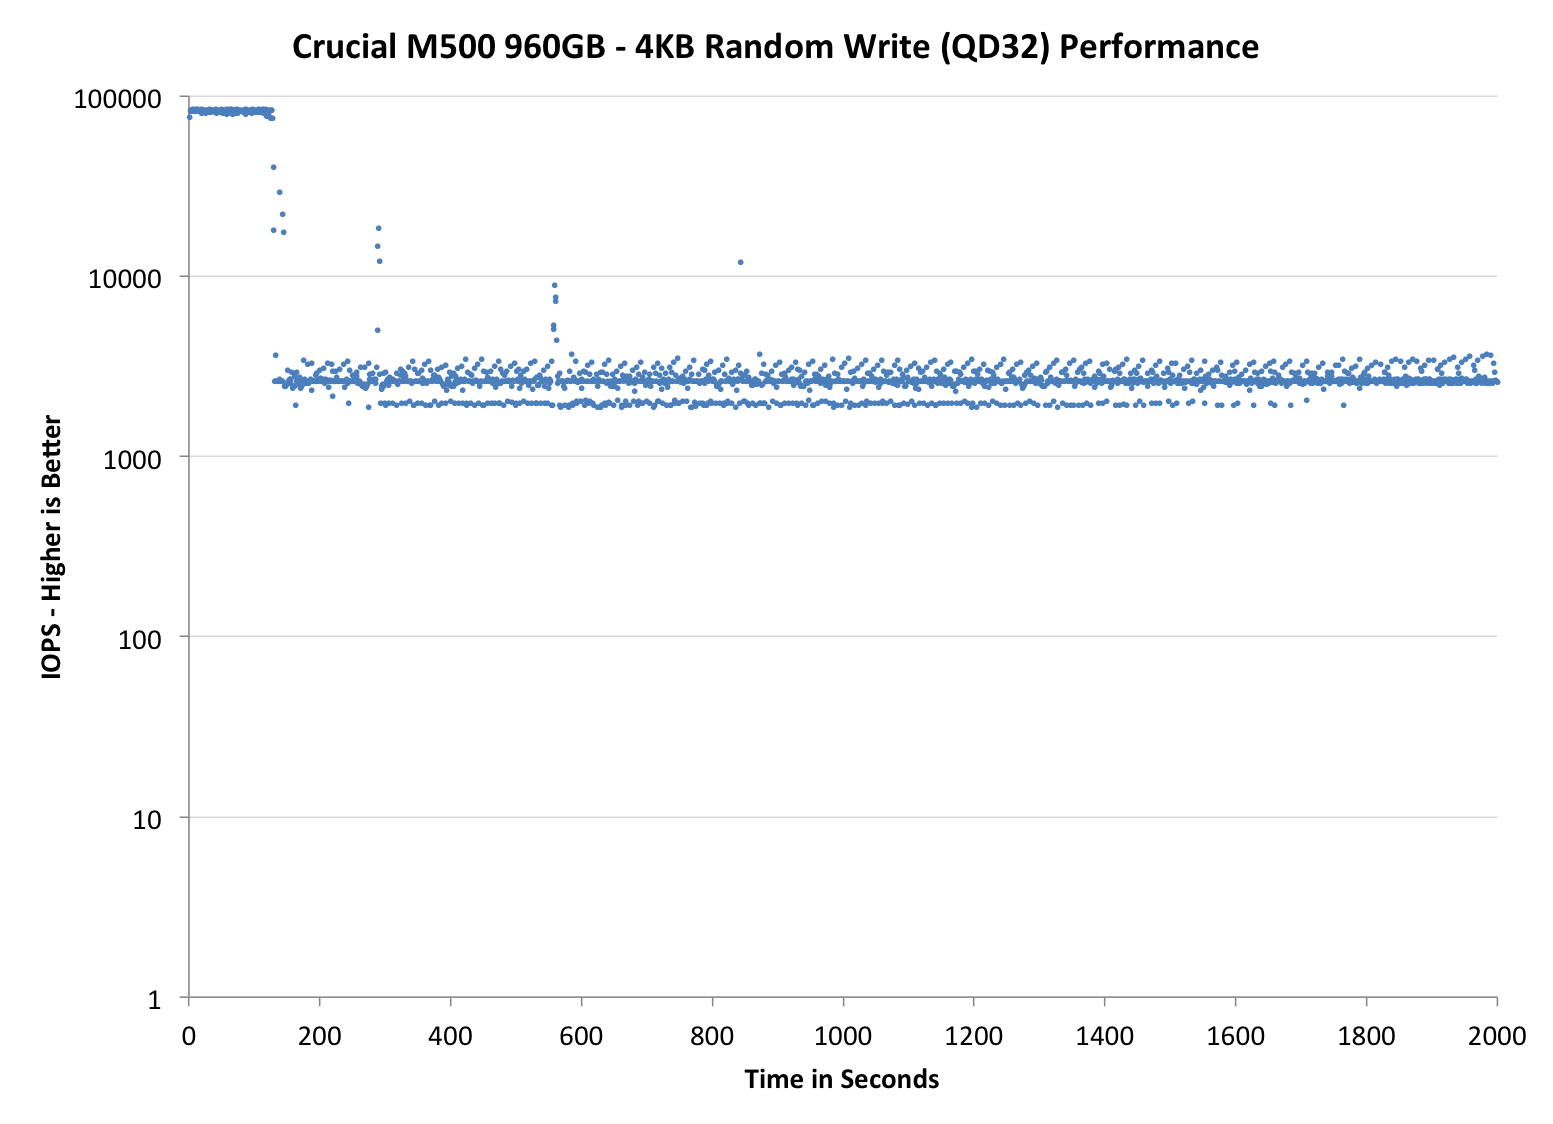
The first set of graphs shows the performance data over the entire 2000 second test period. In these charts you'll notice an early period of very high performance followed by a sharp dropoff. What you're seeing in that case is the drive allocating new blocks from its spare area, then eventually using up all free blocks and having to perform a read-modify-write for all subsequent writes (write amplification goes up, performance goes down).
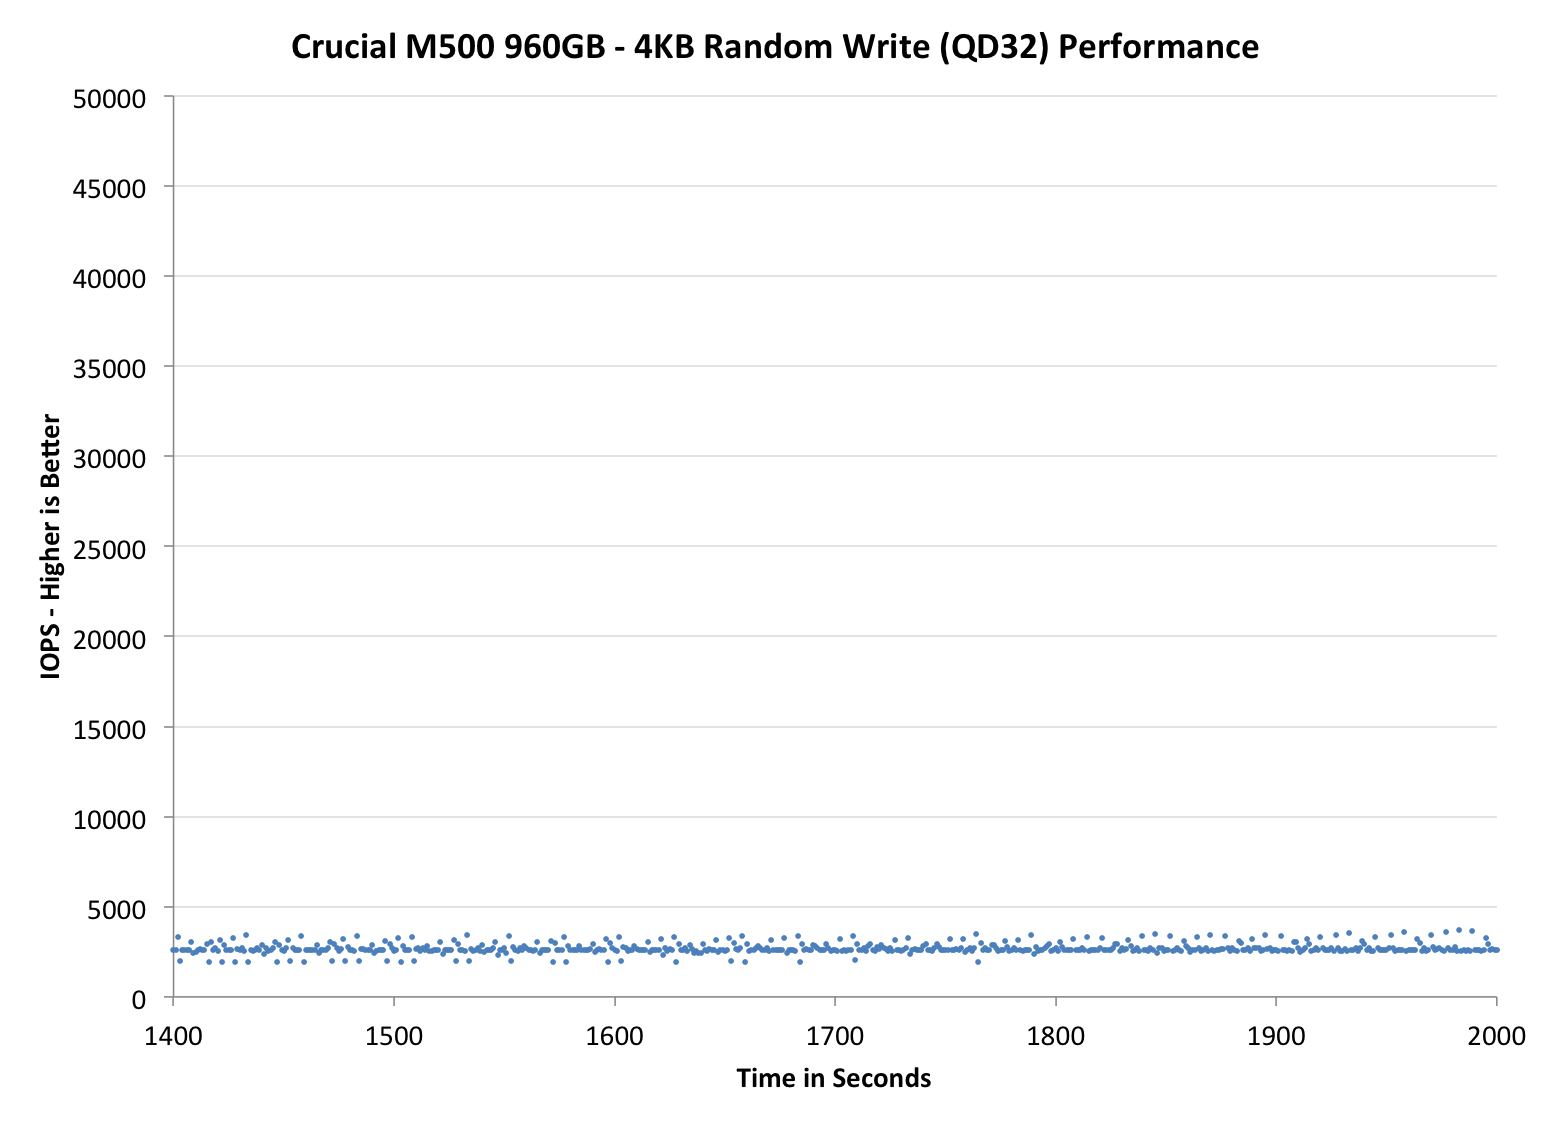
The second set of graphs zooms in to the beginning of steady state operation for the drive (t=1400s). The third set also looks at the beginning of steady state operation but on a linear performance scale. Click the buttons below each graph to switch source data.
 |
|||||||||
| Corsair Neutron 240GB | Crucial m4 256GB | Crucial M500 960GB | Plextor M5 Pro Xtreme 256GB | Samsung SSD 840 Pro 256GB | |||||
| Default | |||||||||
| 25% Spare Area | |||||||||
Like most consumer drives, the M500 exhibits the same pattern of awesome performance for a short while before substantial degradation. The improvement over the m4 is just insane though. Whereas the M500 sees its floor at roughly 2600 IOPS, the m4 will drop down to as low as 28 IOPS. That's slower than mechanical hard drive performance and around the speed of random IO in an mainstream ARM based tablet. To say that Crucial has significantly improved IO consistency from the m4 to the M500 would be an understatement.
Plextor's M5 Pro is an interesting comparison because it uses the same Marvell 9187 controller. While both drives attempt to be as consistent as possible, you can see differences in firmware/gc routines clearly in these charts. Plextor's performance is more consistent and higher than the M500 as well.
The 840 Pro comparison is interesting because Samsung manages better average performance, but has considerably worse consistency compared to the M500. The 840 Pro does an amazing job with 25% additional spare area however, something that can't be said for the M500. Although performance definitely improves with 25% spare area, the gains aren't as dramatic as what happens with Samsung. Although I didn't have time to run through additional spare are points, I do wonder if we might see better improvements with even more spare area when you take into account that ~7% of the 25% spare area is reserved for RAIN.
 |
|||||||||
| Corsair Neutron 240GB | Crucial m4 256GB | Crucial M500 960GB | Plextor M5 Pro Xtreme 256GB | Samsung SSD 840 Pro 256GB | |||||
| Default | |||||||||
| 25% Spare Area | |||||||||
I am relatively pleased by the M500's IO consistency without any additional over provisioning. I suspect that anyone investing in a 960GB SSD would want to use as much of it as possible. At least in the out of box scenario, the M500 does better than the 840 Pro from a consistency standpoint. None of these drives however holds a candle to Corsair's Neutron however. The Neutron's LAMD controller shows its enterprise roots and delivers remarkably high and consistent performance out of the box.
 |
|||||||||
| Corsair Neutron 240GB | Crucial m4 256GB | Crucial M500 960GB | Plextor M5 Pro Xtreme 256GB | Samsung SSD 840 Pro 256GB | |||||
| Default | |||||||||
| 25% Spare Area | |||||||||


111 Comments
View All Comments
mayankleoboy1 - Wednesday, April 10, 2013 - link
thanks! These look much better, and more realworld+consumer usage.metafor - Wednesday, April 10, 2013 - link
I'd be very interested to see an endurance test for this drive and how it compares to the TLC Samsung drives. One of the bigger selling points of 2-level MLC is that it has a much longer lifespan, isn't it?73mpl4R - Wednesday, April 10, 2013 - link
Thank you for a great review. If this is a product that paves the way for better drives with 128Gbit dies, then this is most welcome. Interesting with the encryption aswell, gonna check it out.raclimja - Wednesday, April 10, 2013 - link
power consumption is through the roof.very disappointed with it.
toyotabedzrock - Wednesday, April 10, 2013 - link
If you wrote 1.5 TB of data for this test then you used 2% of the drives write life in 10-11 hours.As a heavy multitasker this worries me greatly. Especially if you edit large video files.
Solid State Brain - Wednesday, April 10, 2013 - link
As I written in one of the comments above, they probably state 72 TiB of maximum supported writes for liability and commercial reasons. They don't want users to be using these as enterprise/professional drives (and chances are that if you write more than 40 GiB/day continuously for 5 years you're not a normal consumer). Most people barely write 1.5 TiB in 6 months of use anyway. So even if 72 TiB don't seem much, they're actually quite a lot of writes.Taking into account drive and NAND specifications, and an average write amplification of 2.0x (although in case of sequential workloads such as video editing this should be much closer to 1.0x), a realistic estimate as a minimum drive endurance would be:
120 GB => 187.5 TiB
240 GB => 375.0 TiB
480 GB => 750.0 TiB
960 GB => 1.46 PiB
Of course, it's not that these drives will stop working after 3000 write cycles. They will go on as long as uncorrectable write errors (which increase as the drive gets used) remain within usable margins.
glugglug - Wednesday, April 10, 2013 - link
It is very easy to come up with use cases where a "normal" user will end up hitting the 72TB of writes quickly.Most obvious example is a user who is using this large SSD to transition from a large HDD without it being "just a boot drive", so they archive a lot of stuff.
Depending on MSSE settings, it will likely uncompress everything into C:\Windows\Temp when it does scans each night scan.
You don't want to know how much of my X-25M G1's lifespan I killed in about 6 months time before finding out about that and junctioning my temp directories off of the SSD.
Solid State Brain - Wednesday, April 10, 2013 - link
I am currently using a Samsung 840 250GB with TLC memory, without any hard disk installed in my system. I use it for everything from temp files to virtual machines to torrents. I even reinstalled the entire system a few times because I hopped between Linux and Windows "just because". I haven't performed any "SSD optimization" either. A purely plug&play usage, and it isn't a "boot drive" either. Furthermore, my system is always on. Not quite a normal usage I'd say.In 47 days of usage I've written 2.12 TiB and used 10 write cycles out of 1000. This translates in 13 years of drive life at my current usage rate.
My usage graph + SMART data:
http://i.imgur.com/IwWZ9Kg.png
Temp directories alone aren't going to kill your SSD, not directly at least. It likely was something caused by some anomalous write-happy application, not Windows by itself.
juhatus - Wednesday, April 10, 2013 - link
What would you recommend overprovisioning for 256Gb M4 with bitlocker, 10-15-25% ? Also what was the M4's firmware you used to compare to M500? Also are there any benefits for M500 with bitlocker on windows 7? thanks for review, please add 25% results for M4 too :)Solid State Brain - Wednesday, April 10, 2013 - link
Increasing overprovisioning is only going to matter when continuously writing to the drive without never (or rarely) executing a TRIM operation every time an amount of data roughly equivalent (in practice, less, depending on workload and drive conditions) to the amount of free space gets written.This almost never happens in real life usage by the target userbase of such a drive. It's a matter for servers, for those who for a reason or another (like hi-definition video editing) perform many sustained writes, or for those working in an environment without TRIM support (which isn't the case for Windows 7/8, although it can be for MacOS or Linux - where it has to be manually enabled).
Anandtech SSD benchmarks aren't very realistic for most users, and the same can be said for their OP reccomendations.