The ARM vs x86 Wars Have Begun: In-Depth Power Analysis of Atom, Krait & Cortex A15
by Anand Lal Shimpi on January 4, 2013 7:32 AM EST- Posted in
- Tablets
- Intel
- Samsung
- Arm
- Cortex A15
- Smartphones
- Mobile
- SoCs
Cortex A15: SunSpider 0.9.1
SunSpider performance in Chrome on the Nexus 10 isn't all that great to begin with, so the Exynos 5250 curve is longer than the competition. I wouldn't pay too much attention to overall performanceas that's more of a Chrome optimization issue, but we begin to shine some light on Cortex A15's power consumption:

Although these line graphs are neat to look at, it's tough to quantify exactly what's going on here. Following every graph from here on forward I'll present a bar chart that integrates over the benchmark time period (excluding idle) and presents total energy used during the task in Joules.
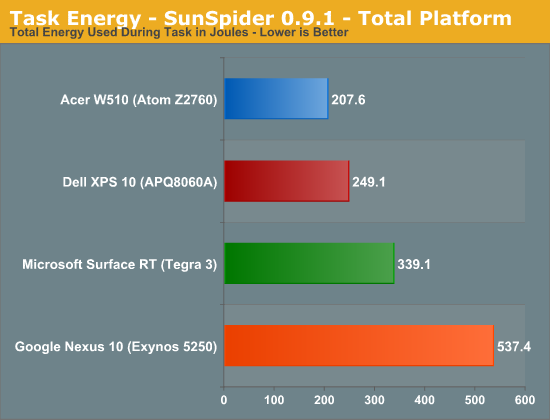
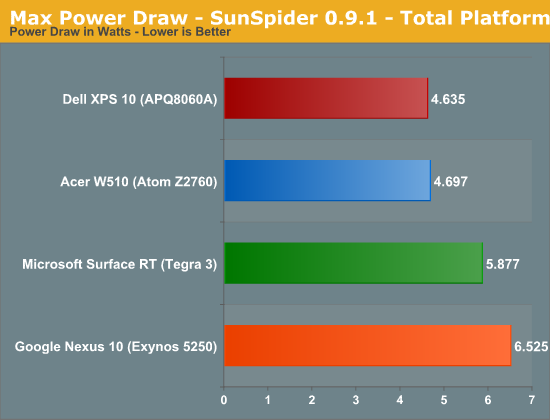
The data here reflects what you see in the chart above fairly well. Acer/Intel manage to get the edge over Dell/Qualcomm when it comes to total energy consumed during the test. The Nexus 10 doesn't do so well here but that's likely a software issue more than anything else.

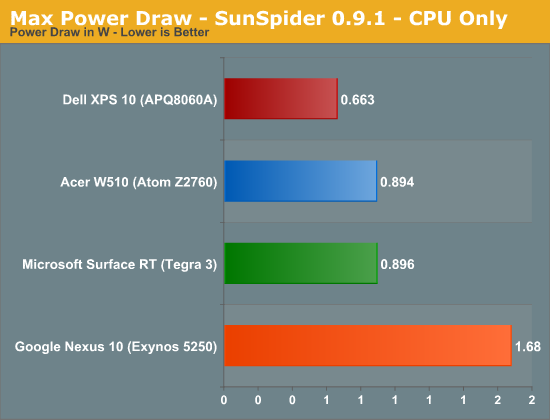
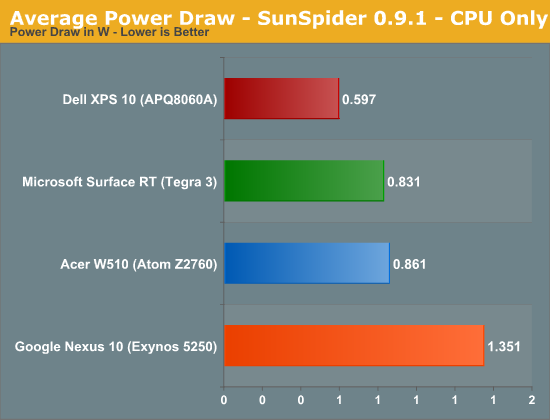
CPU power is just insane. Peak power consumption is around 3W, compared to around 1W for the competition.
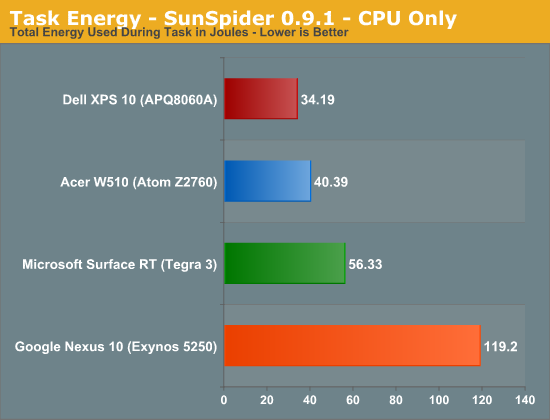
Looking at the CPU core itself, Qualcomm appears to have the advantage here but keep in mind that we aren't yet tracking L2 cache power on Krait (but we are on Atom). Regardless Atom and Krait are very close.
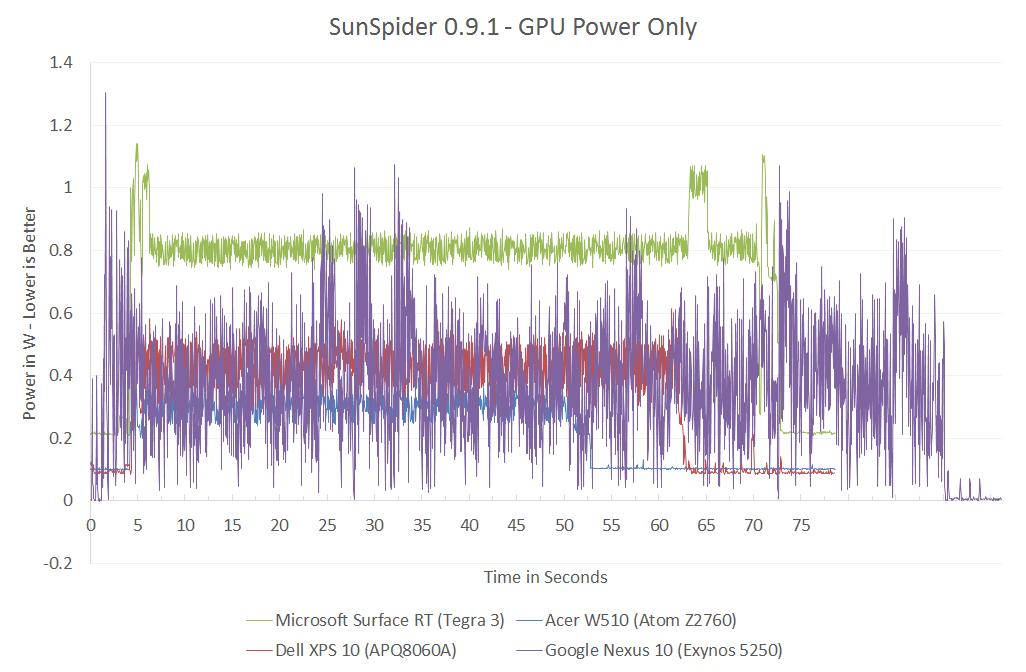
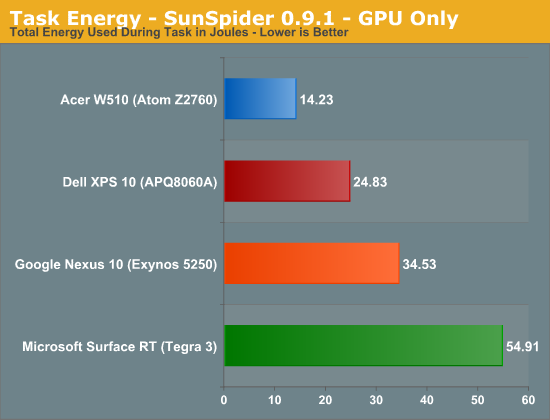
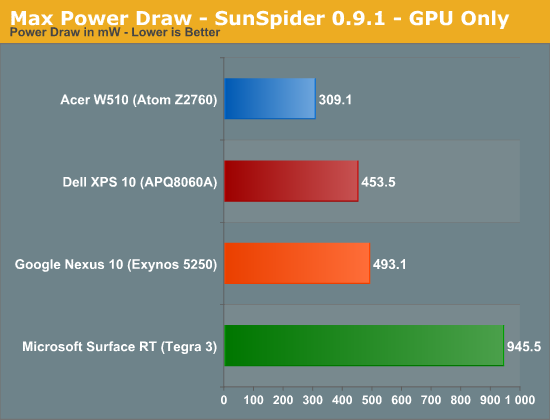
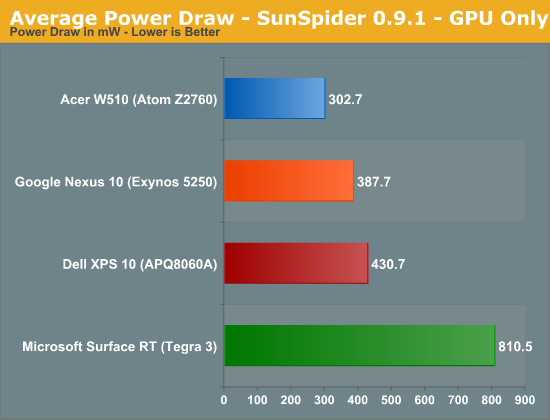
Even GPU power consumption is pretty high compared to everything else (minus Tegra 3).
SunSpider - Max, Avg, Min Power
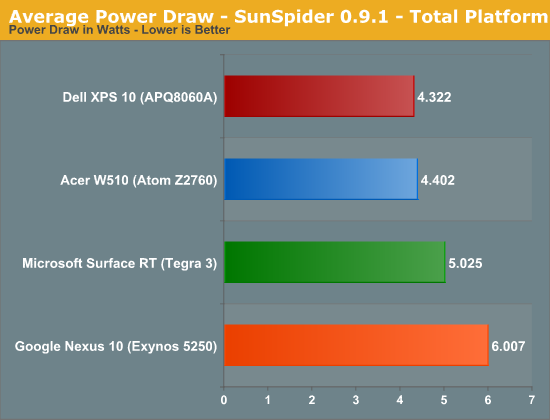
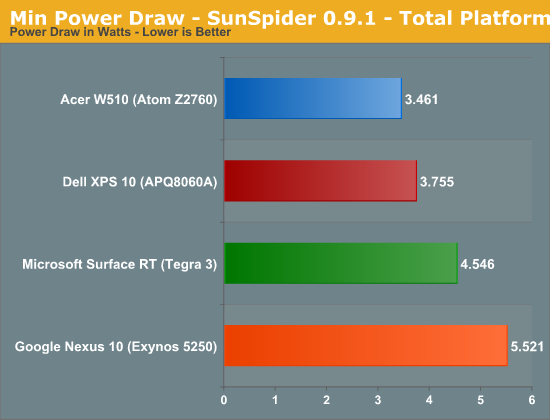
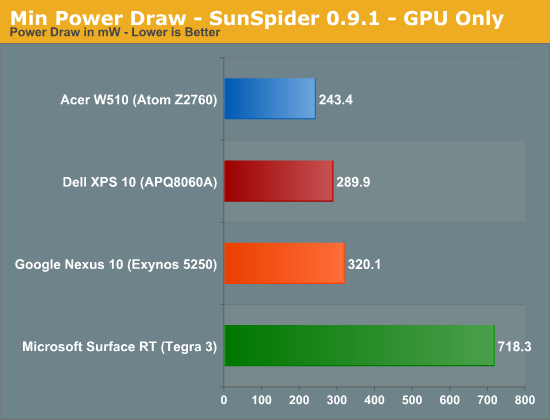
For your reference, the remaining graphs present max, average and min power draw throughout the course of the benchmark (excluding beginning/end idle times).
Average Power Draw
Minimum Power Draw
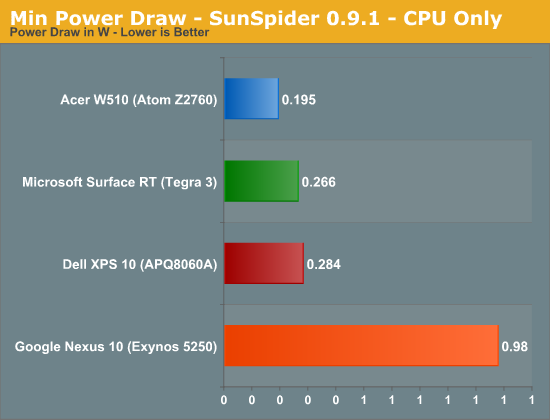


140 Comments
View All Comments
Kidster3001 - Friday, January 4, 2013 - link
Samsung uses everyone's chips in their phones. Samsung, Qualcomm, TI... everyone's. I would not be surprised to see a Samsung phone with Atom in it eventually.jeffkibuule - Friday, January 4, 2013 - link
They've never used other non-Samsung SoCs by choice, especially in their high end phones. They only used Qualcomm MSM8960 in the US GS III because Qualcomm's separate baseband MDM9615 wasn't ready. As soon as it was, we saw the Galaxy Note II use Exynos again. Nvidia and TI chips have been used in the low end from Samsung, but that's not profitable to anyone.Intel needs a major design win from a tier one OEM willing to put its chip inside their flagship phone, and with most phone OEMs actually choosing to start designing their own ARM SoCs (including even LG and Huawei), that task is getting a lot harder than you might think.
felixyang - Saturday, January 5, 2013 - link
some versions of Samsung's GS2 use TI's OMAP.iwod - Saturday, January 5, 2013 - link
Exactly like what is said above. If they have a choice they would rather use everything they produce themselves. Simply Because Wasted Fabs Space is expensive.Icehawk - Friday, January 4, 2013 - link
I find these articles very interesting - however I'd really like to see an aggregate score/total for power usage, IOW what is the area under the curve? As discussed being quicker to complete at higher power can be more efficient - however when looking at a graph it is very hard to see what the total area is. Giving a total wattage used during the test (ie, area under curve) would give a much easier metric to read and it is the important #, not what the voltage maxes or minimums at but the overall usage over time/process IMO.extide - Friday, January 4, 2013 - link
There are indeed several graphs that display total power used in joules, which is the area under the curve of the watts graphs. Maybe you missed them ?jwcalla - Friday, January 4, 2013 - link
That's what the bar charts are showing.GeorgeH - Friday, January 4, 2013 - link
It's already there. A Watt is a Joule/Second, so the area under the power/time graphs is measured in Watts * Seconds = Joules.Veteranv2 - Friday, January 4, 2013 - link
Another Intel PR Article, it is getting really sad on this website.Now since you are still using Win8 which is garbage for ARM. Please us the correct software platform for ARM chips. I'd love to see those power measurements then.
Anandtech did it again. Pick the most favorable software platform for Intel, give the least favorable to ARM.
Way to go! Again....
Intel PR at its best...
Veteranv2 - Friday, January 4, 2013 - link
Oh wait its even better!They used totally different screens with almost 4 times the pixels on the nexus 10 and then says it requires more power to do benchmarks. Hahaha, this review gave me a good laugh. Even worse then the previous ones.
This might explain the lack of product overviews at the start.