AMD Zen 4 Ryzen 9 7950X and Ryzen 5 7600X Review: Retaking The High-End
by Ryan Smith & Gavin Bonshor on September 26, 2022 9:00 AM ESTCPU Benchmark Performance: Power, Web, And Science
Our previous set of ‘office’ benchmarks has often been a mix of science and synthetics, so this time we wanted to keep our office section purely on real-world performance. We've also incorporated our power and science testing into this section too.
In this version of our test suite, all the science-focused tests that aren’t ‘simulation’ work are now in our science section. Where possible these benchmarks have been optimized with the latest in vector instructions.
We are using DDR5 memory on the Ryzen 9 7950X and Ryzen 5 7600X, as well as Intel's 12th Gen (Alder Lake) processors at the following settings:
- DDR5-5200 CL44 - Ryzen 7000
- DDR5-4800 (B) CL40 - Intel 12th Gen
All other CPUs such as Ryzen 5000 and 3000 were tested at the relevant JEDEC settings as per the processor's individual memory support with DDR4.
Power
The nature of reporting processor power consumption has become, in part, a dystopian nightmare. Historically the peak power consumption of a processor, as purchased, is given by its Thermal Design Power (TDP, or PL1). For many markets, such as embedded processors, that value of TDP still signifies the peak power consumption. For the processors we test at AnandTech, either desktop, notebook, or enterprise, this is not always the case.
Modern high-performance processors implement a feature called Turbo. This allows, usually for a limited time, a processor to go beyond its rated frequency. Exactly how far the processor goes depends on a few factors, such as the Turbo Power Limit (PL2), whether the peak frequency is hard coded, the thermals, and the power delivery. Turbo can sometimes be very aggressive, allowing power values 2.5x above the rated TDP.
AMD and Intel have different definitions for TDP but are broadly speaking, applied the same. The difference comes from turbo modes, turbo limits, turbo budgets, and how the processors manage that power balance. These topics are 10000-12000 word articles in their own right, and we’ve got a few articles worth reading on the topic.
- Why Intel Processors Draw More Power Than Expected: TDP and Turbo Explained
- Talking TDP, Turbo and Overclocking: An Interview with Intel Fellow Guy Therien
- Reaching for Turbo: Aligning Perception with AMD’s Frequency Metrics
- Intel’s TDP Shenanigans Hurts Everyone
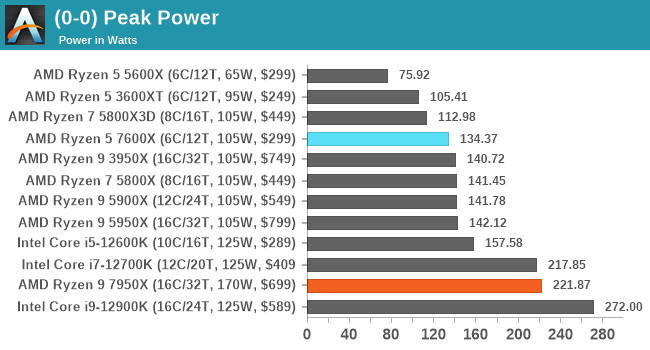
Looking at the results of our Peak Power test, the Ryzen 9 7950X topped out at 221.8 W, which is around 30% higher than the TDP of 170 W it comes with. As stated by AMD, the Power Package Tracking or PPT limit for AM5 motherboards when used with 170W TDP Ryzen 7000 SKUs will be 230 W. Still, while it draws more power than its generational predecessors such as Zen 3 and Zen 2, the Zen 4-based Ryzen 7000 series benefits from higher core clock speeds, a higher single core boost frequency, as well as other implementations around TSMC's 5 nm manufacturing process.
The AMD Ryzen 5 7600X is more aimed at the mid-range, and as such has a lower overall power draw, with the peak power figures in our testing reaching 134.3 W. This is around the same levels of power draw as the Ryzen 9 3950 X, the Ryzen 9 5900X, and the Ryzen 7 5800X. Per AMD's specifications, the Ryzen 5 7600X has a TDP of 105 W, with around a 27 % variance in peak power compared to TDP.
From our testing, so far, it seems that Ryzen 7000 when combined with a premium X670E motherboard allows for up to 30% in terms of extra power allowances for higher single-core boost and overall faster all-core frequencies.
Web
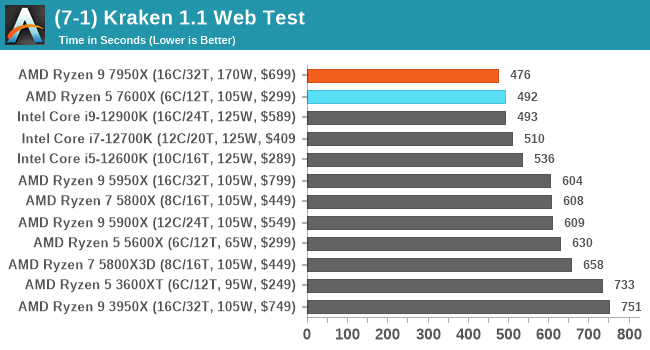
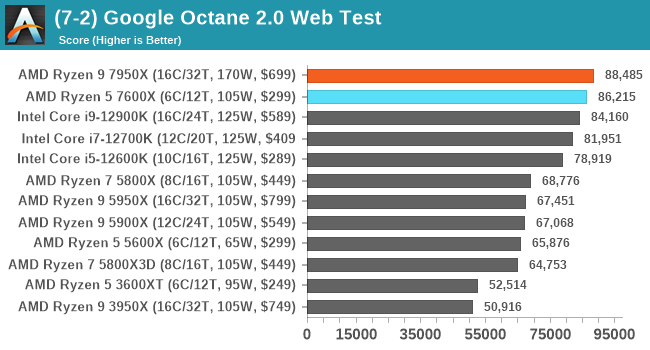
In our web tests, the overall improvements in IPC, frequency, clock speeds, and the switch to DDR5 all play a part in performance here. Both the Ryzen 9 7950X and Ryzen 7 7600X top our charts in regards to web testing, although performance isn't as apparent as it should be in other areas.
Science
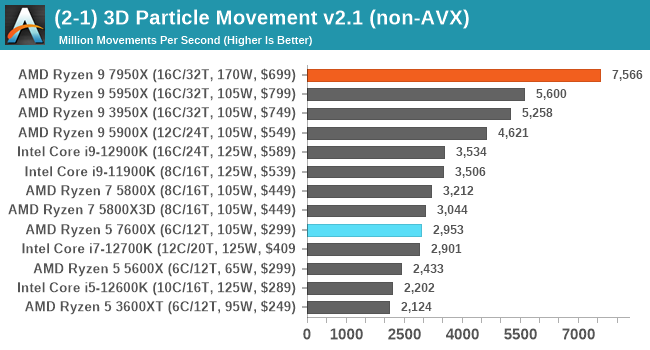
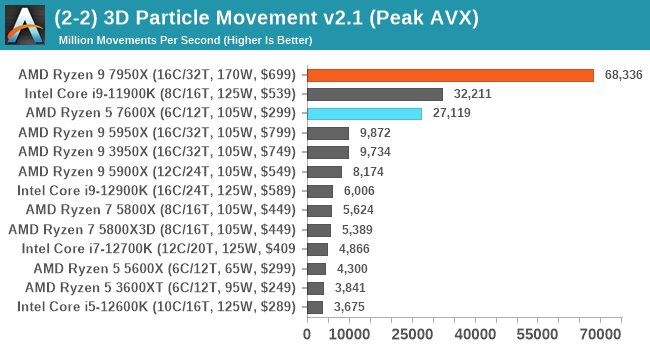
For our 3DPM v2.1 testing, we added in the Intel Core i9-11900K (Rocket Lake) to show performance across AVX workloads. Although Intel officially fused off the AVX2/512 extensions on Alder Lake which did cause a little controversy and gave the impression that AVX-512 on consumer platforms was dead. AMD clearly believes the opposite, as it has implemented it so that AVX-512 runs two cycles over a 256-bit wide instruction. The performance of the Ryzen 9 7950X here is phenomenal, although the Core i9-11900K which did indeed feature AVX instruction sets in the silicon, is still better than the Ryzen 5 7600X with AVX workloads.
Focusing on our more science-based tests, both the Ryzen 9 7950X and Ryzen 5 7600X perform well against the competition. In our 3DPMv2.1 test in non-AVX, the Ryzen 9 7950X provided a jump of 35% in performance against the previous generation Ryzen 9 5950X processor.
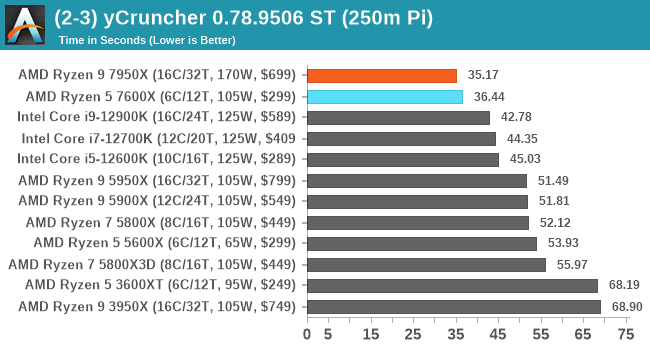
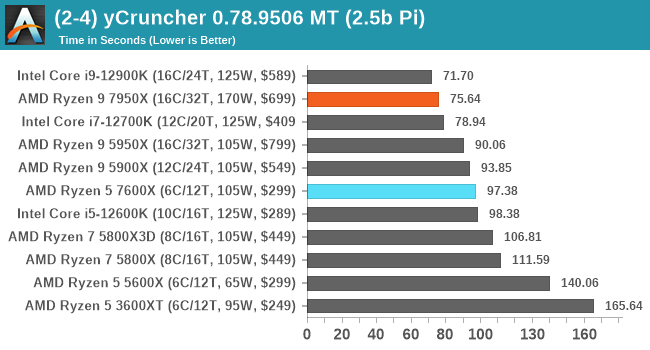
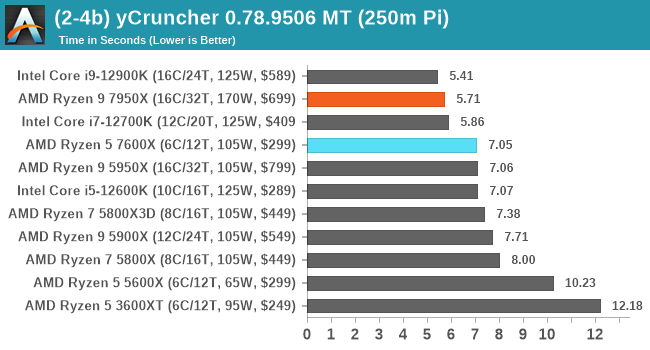
Interestingly, in our yCruncher 0.78 test, the Ryzen 9 7950X and the Core i9-12900K trade blows consistently, although the Ryzen 5 7600X performs well for its price point.


205 Comments
View All Comments
Iketh - Thursday, October 6, 2022 - link
why are you giving so much credit to ddr5? moving to new memory has always given very small gains (if any) in the beginningtjunction is an arbitrary number set by AMD, so using that as an argument is irrational Reply
xol - Tuesday, September 27, 2022 - link
..but my main criticism was of the article - eg phrases like " increase the overall TDP ... without too much penalty" doesn't really make any sense - increase TDP is the penaltyBut much of the article is written as if letting TDP go *much* higher is some sort of gift from AMD -eg the examples I gave
The article is full of nothin-burgers like this statement :
" We feel that the higher all-core frequencies under maximum load, 95°C is a sufficient level of heat for what is on offer when it comes to overall performance" Reply
kwrzesien - Monday, September 26, 2022 - link
Whomever was the last to edit the front page needs to disable the trackpad and clean their mouse ball! 🤣 ReplyThreska - Monday, September 26, 2022 - link
"But now with AMD’s modern RDNA 2 graphics architecture and TSMC fabrication process, AMD has finally seen the (ray traced) light, and is building a small GPU block into the IOD to offer integrated graphics throughout the Ryzen 7000 product stack."I see things like SAM and HSA being a future trend.
https://www.electronicdesign.com/technologies/micr... Reply
erotomania - Wednesday, September 28, 2022 - link
Yes, AMD thought so too, in 2012...https://www.tomshardware.com/reviews/fusion-hsa-op...
and in 2014 here at AT...
https://www.anandtech.com/show/7677/amd-kaveri-rev...
Hopefully this time! Reply
nandnandnand - Monday, September 26, 2022 - link
It seems that going up by 1 GHz didn't help it that much in gaming benchmarks.Meanwhile, the 65W results show that any Zen 4 and later APUs are going to be absurdly powerful. Especially Dragon Range. Reply
Josh128 - Monday, September 26, 2022 - link
Any way you guys can add the single core ECO mode results to the conclusion page or to the R23 results on its respective page? Replydonquixote42 - Monday, September 26, 2022 - link
Single threaded workload would not use more than 65W anyway. So performance should be the same in ECO and non-ECO mode. ReplyJosh128 - Monday, September 26, 2022 - link
Still using a 2080Ti for the games testing is not good. Most certainly many of these results are GPU bound. Replysnowdrop - Monday, September 26, 2022 - link
No power consumption numbers? Will the article be updated with these when they're ready? Reply