The 2020 Mac Mini Unleashed: Putting Apple Silicon M1 To The Test
by Andrei Frumusanu on November 17, 2020 9:00 AM ESTSPEC2006 & 2017: Industry Standard - ST Performance
Single-threaded performance of the new M1 is certainly one of its key aspects, where the new Firestorm cores definitely punch far above their power class. We had hinted in our preview A14 analysis article that the M1 may well be ending up as not only the top-performing low-power mobile CPU out there, but actually end up as the top-performing absolute performance amongst all CPUs in the market. The A14 fell short of that designation, but the M1 is an even faster implementation of the new Firestorm cores.
It’s to be noted that we’re comparing the M1 to the absolute best desktop and laptop platforms on the market right now, solely looking at absolute best single-threaded performance.
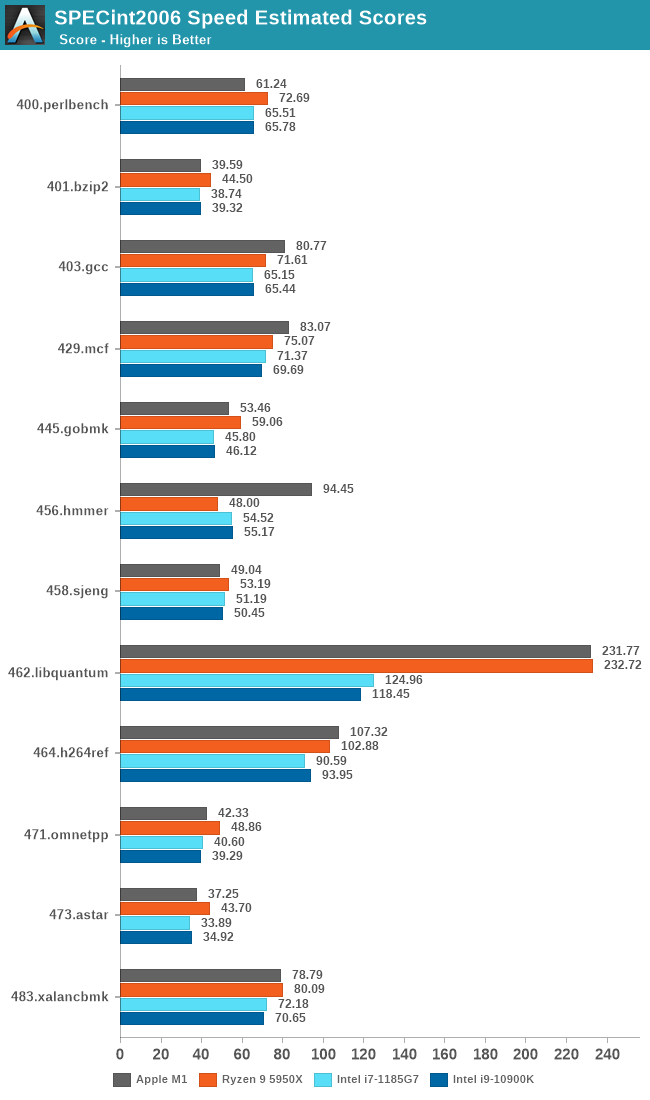
In SPECint2006, we’re now seeing the M1 close the gap to AMD’s Zen3, beating it in several workloads now, which increasing the gap to Intel’s new Tiger Lake design as well as their top-performing desktop CPU, which the M1 now beats in the majority of workloads.
Since our A14 results, we’ve been able to track down Apple’s compiler setting which increases the 456.hmmer by such a dramatic amount – Apple defaults the “-mllvm -enable-loop-distribute=true” in their newest compiler toolchain whilst it needs to be enabled on third-party LLVM compilers. A 5950X with the flag enabled increases its score to 91.64, but also while seeing some regressions in other tests. We haven’t had time to re-test further platforms.
The M1’s performance boost in 462.libquantum is due to the increased L2 cache, as well as the doubled memory bandwidth of the system, something that this workload is very hungry of.
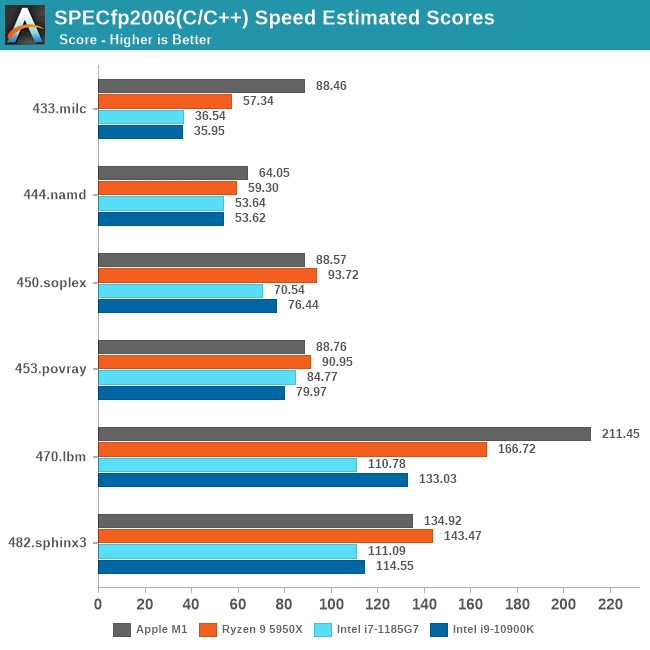
In the fp2006 workloads, we’re seeing the M1 post very large performance boosts relative to the A14, meaning that it now is able to claim the best performance out of all CPUs being compared here.
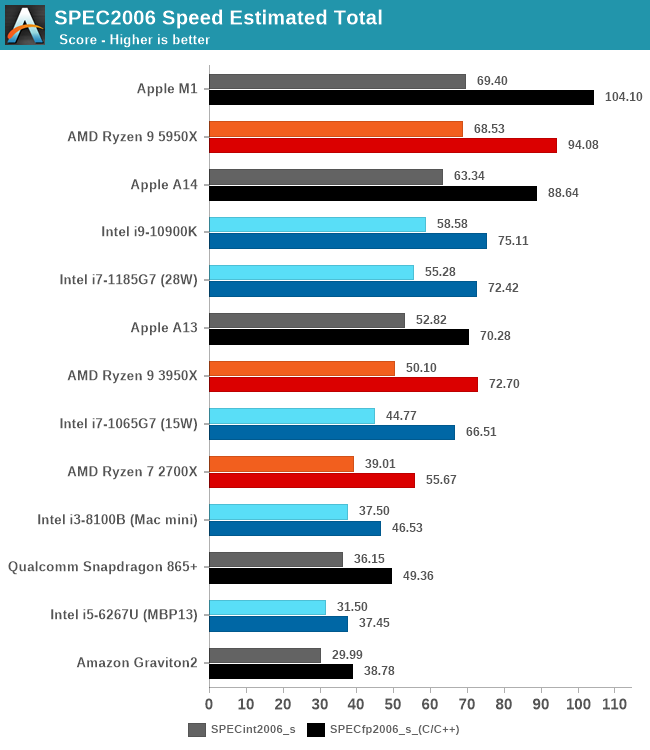
In the overall score, the M1 increases the scores by 9.5% and 17% over the A14. In the integer score, the M1 takes the lead here, although if we were to account for the 456.hmmer discrepancy it would still favour the Zen3-based 5950X. In the floating-point score however, the Apple M1 now takes a large lead ahead, making it the best performing CPU core.
We’ve had a lot arguments about whether 2006 is relevant or not in today’s landscape. We have practical reasons for not yet running SPEC2017 on mobile devices, but given that the new Apple Silicon M1 runs on macOS, these concerns are not valid, thus enabling us to also run the more modern benchmark suite.
It’s to be noted that currently we do not have a functional Fortran compiler on Apple Silicon macOS systems, thus we have to skip several workloads in the 2017 suite, which is why they’re missing from the graphs. We’re concentrating on the remaining C/C++ workloads.
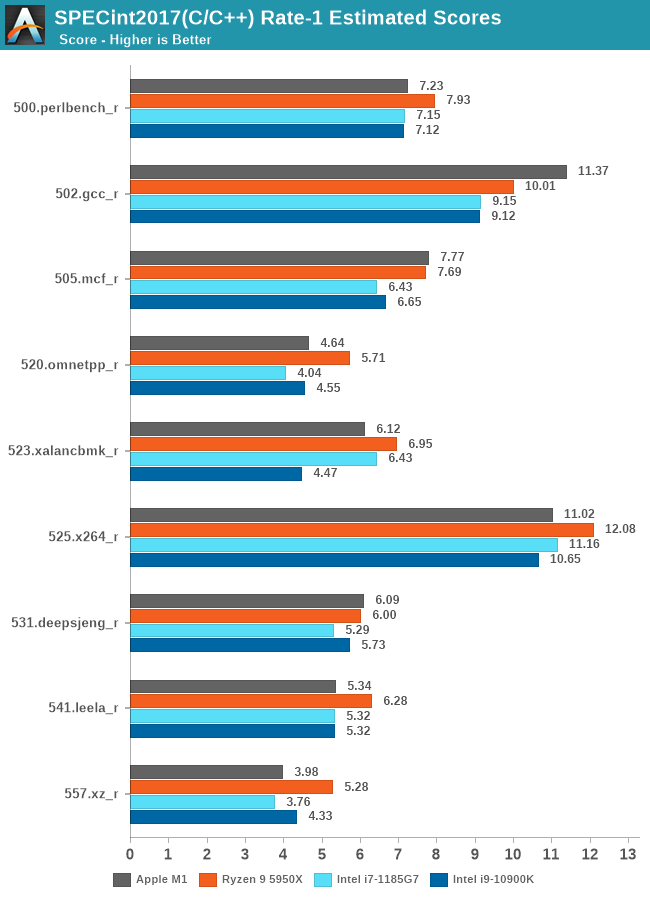
The situation doesn’t change too much with the newer SPECint2017 suite. Apple’s Firestorm core here remains extremely impressive, at worst matching up Intel’s new Tiger Lake CPU in single-threaded performance, and at best, keeping up and sometimes beating AMD’s new Zen3 CPU in the new Ryzen 5000 chips.
Apple’s performance is extremely balanced across the board, but what stands out is the excellent 502.gcc_r performance where it takes a considerable leap ahead of the competition, meaning that the new Apple core does extremely well on very complex code and code compiling.
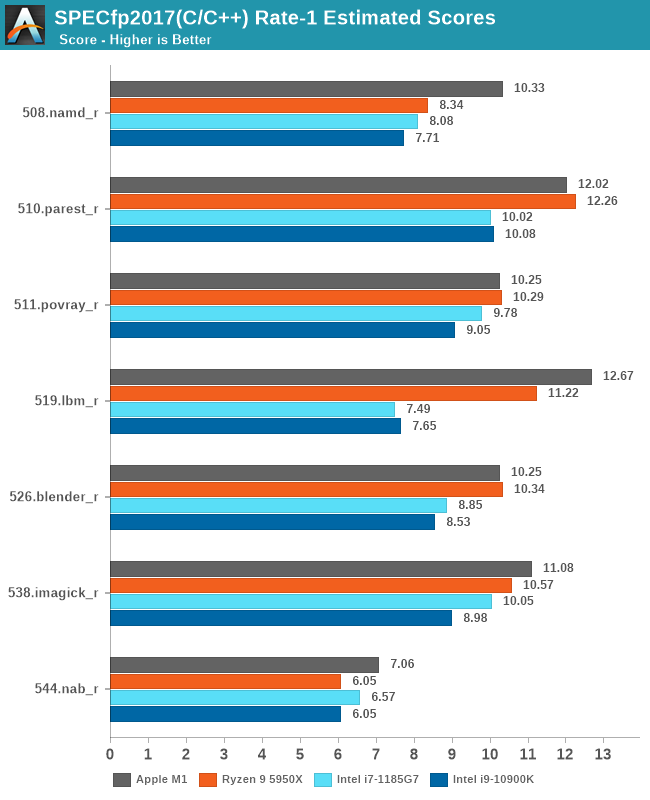
In SPECfp2017, we’re seeing something quite drastic in terms of the scores. The M1 here at worst is a hair-width’s behind AMD’s Zen3, and at best is posting the best absolute performance of any CPU in the market. These are incredible scores.
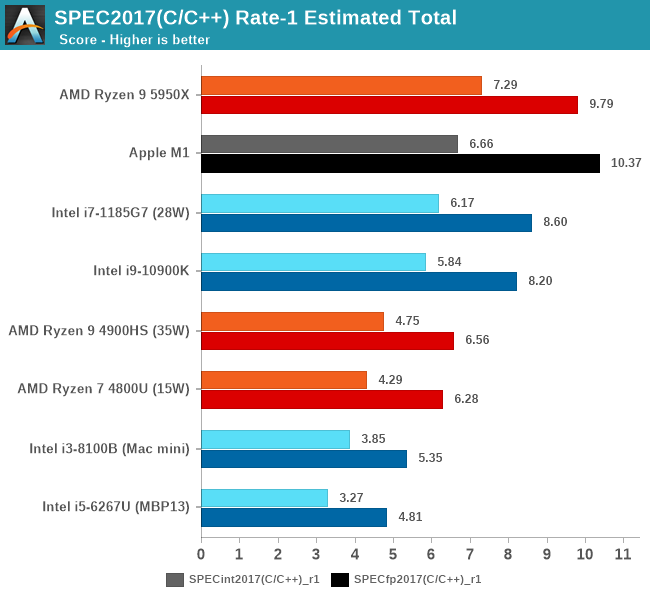
In the overall new SPEC2017 int and fp charts, the Apple Silicon M1 falls behind AMD’s Zen3 in the integer performance, however takes an undisputable lead in the floating-point suite.
Compared to the Intel contemporary designs, the Apple M1 is able to showcase a performance leap ahead of the best the company has to offer, with again a considerable strength in the FP score.
While AMD’s Zen3 still holds the leads in several workloads, we need to remind ourselves that this comes at a great cost in power consumption in the +49W range while the Apple M1 here is using 7-8W total device active power.


682 Comments
View All Comments
thunng8 - Sunday, November 22, 2020 - link
What are the cinebench results of the 4800u running at 15w. All I see is the 4800u running benchmark it is well over 40w.For example here: https://www.notebookcheck.net/The-Ryzen-7-4800U-is...
Power usage peaks at 57w and in games the laptop maintains 49w indefinitely. That is very very far from 15w.
Anandtech has actually test the m1 with fan in the mini and it uses 15w in cinebench and scores 7700. The non active cooled MacBook Air uses 7w when thermally throttled (this is in the 30min run) and scores approx 6000
BushLin - Sunday, November 22, 2020 - link
notebookcheck are testing a 4800U in 25W mode and stressing CPU+GPU simultaneously.Here's accurate charts of the 4800U in 15W mode.
https://www.anandtech.com/show/16084/intel-tiger-l...
thunng8 - Sunday, November 22, 2020 - link
Here is some actual figures for a Renoir system.https://forums.anandtech.com/threads/new-apple-soc...
Constrained to 25w, it score 6600.
While m1 scores 7700 at 15w.
https://twitter.com/i/web/status/13287773335122780...
The 4800u would be using 40w+ to outperform the m1 at 15w.
BushLin - Sunday, November 22, 2020 - link
Results are for a different, 4700U CPU, posted by some random person.Why not simply look at the results from the article you're leaving a comment on? Which are more likely to be taken under controlled conditions.
thunng8 - Sunday, November 22, 2020 - link
I am looking for actual performance results at 15w, not boosted to 40w or higher which all 4800u seems to do.BushLin - Sunday, November 22, 2020 - link
Didn't take much effort to find the 15W M1 and 15W 4800U have very similar power draw, if that's what you're actually looking for.They both boost above their rated power in a similar way.
https://images.anandtech.com/graphs/graph16252/119...
https://images.anandtech.com/doci/16084/Power%20-%...
thunng8 - Sunday, November 22, 2020 - link
I was looking for specific cinebench results which you alluded to was running faster than M1 while using the same power. The few videos I have seen shows the 4800U laptops fan spinning up to maximum over most of the entire Cinebench 10min run while the M1 fans (in the macbook pro) was not audible and the air has no fan at all.BushLin - Monday, November 23, 2020 - link
https://images.anandtech.com/graphs/graph16252/119...Ppietra - Monday, November 23, 2020 - link
BushLinBut those aren’t the real power draw numbers for the M1 and 4800U laptops in the tests. The 4800U 15W is just a reference, no measurements were made for the power consumption during Cinebench. The 4800U can draw much more power than 15W.
As for the Mac mini the power draw shown is for the all computer, not just the processor. If you had bothered reading thunng8 links you would see that M1 power consumption probably tops at 15W during Cinebench.
I have seen tests where a 4800U laptop consumes almost 3 times more power than a MacBook Pro with a M1 chip, during Cinebench. It’s the power consumption of the laptops not the chips but the difference is gigantic.
BushLin - Tuesday, November 24, 2020 - link
The power measurement for both systems is at the wall rather than just the SoC and the numbers available from this site, under controlled conditions, show a similar power draw under a multithreaded workload. There is a difference in depending on factors like AVX instructions but the 4800U in 15W mode is demonstrably pulling similar amounts of power to an M1 in 15W mode running a similar workload.The 4800U can be run in a higher, 25W power mode but not on the pages I've linked as it wasn't used to get the cinebench results on this article.