AMD Zen 3 Ryzen Deep Dive Review: 5950X, 5900X, 5800X and 5600X Tested
by Dr. Ian Cutress on November 5, 2020 9:01 AM ESTTDP and Power Draw: No Real Surprises
The nature of reporting processor power consumption has become, in part, a dystopian nightmare. Historically the peak power consumption of a processor, as purchased, is given by its Thermal Design Power (TDP, or PL1). For many markets, such as embedded processors, that value of TDP still signifies the peak power consumption. For the processors we test at AnandTech, either desktop, notebook, or enterprise, this is not always the case.
Modern high performance processors implement a feature called Turbo. This allows, usually for a limited time, a processor to go beyond its rated frequency. Exactly how far the processor goes depends on a few factors, such as the Turbo Power Limit (PL2), whether the peak frequency is hard coded, the thermals, and the power delivery. Turbo can sometimes be very aggressive, allowing power values 2.5x above the rated TDP.
AMD and Intel have different definitions for TDP, but are broadly speaking applied the same. The difference comes to turbo modes, turbo limits, turbo budgets, and how the processors manage that power balance. These topics are 10000-12000 word articles in their own right, and we’ve got a few articles worth reading on the topic.
- Why Intel Processors Draw More Power Than Expected: TDP and Turbo Explained
- Talking TDP, Turbo and Overclocking: An Interview with Intel Fellow Guy Therien
- Reaching for Turbo: Aligning Perception with AMD’s Frequency Metrics
- Intel’s TDP Shenanigans Hurts Everyone
In simple terms, processor manufacturers only ever guarantee two values which are tied together - when all cores are running at base frequency, the processor should be running at or below the TDP rating. All turbo modes and power modes above that are not covered by warranty.
For AMD’s new Ryzen 5000 processors, most of them have a 105 W TDP, with a Package Power Tracking (PPT) setting of 142 W. For these processors, we can see our peak power consumption through our testing matching that value. For the sole 65 W processor, the PPT value is 88 W, and we’re seeing only 76 W, showing some of the efficiencies on the Ryzen 5 5600X.
If we look directly at the Ryzen 9 5950X for chip wide power consumption over per-core loading, we get this following graph. Here we are reporting two of the values that we have access to on the chip, which the chip estimates as part of its turbo detection and action algorithms: total package power (for the whole chip), and the power solely used by the sum of cores, which includes the L3 cache. The difference between the two covers the IO die as well as any chiplet-to-chiplet communications, PCIe, CPU-to-chipset, and DRAM controller consumption.
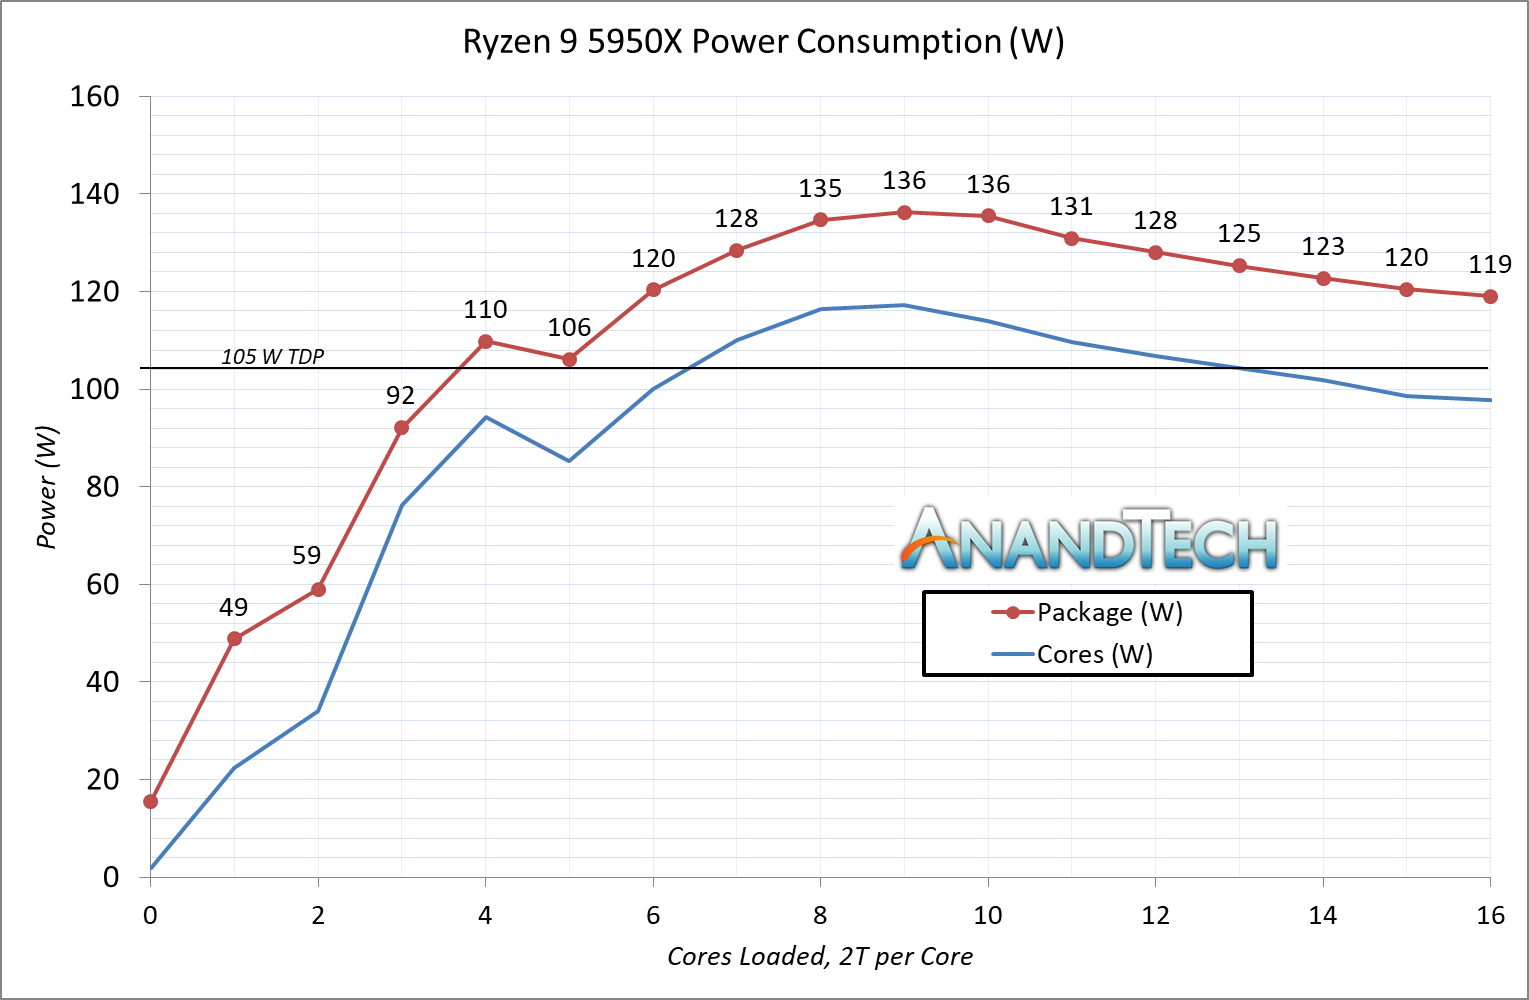
There are two significant features of this graph.
First is the hump, and a slow decrease in total package power consumption after 8-10 core loading. We saw this when we first tested the previous generation 3950X, and is indicative of how the processor has increased current density as it loads up the cores, and as a result there’s a balance between the frequency it can give, delivering the power, and applying the voltage in a consistent way. We’re seeing the difference between the two values also increasing slightly, as more data is transferred over those off-chiplet communications. We see this effect on the 5900X as well, perhaps indicating this is a feature of the dual chiplet design – we’re not seeing it on the 5800X or 5600X.
The second feature is an odd dip in power moving from 4 to 5 cores loaded. Looking into the data, the frequency of the active cores drops from 4725 to 4675, which isn’t a big drop, however the voltage decreases from 1.38 V to 1.31 V, which seems to be more sizeable drop than other voltage readouts as we scale the core-to-core loading. There’s also a bigger increase in non-core power, up from 16 W to 21 W, which perhaps decreases the power to the cores, reducing the voltage.
This might be an odd quirk of our specific chip, our power test, or it might be motherboard or BIOS specific (or a combination of several factors). We might go back in future on other boards to see if this is consistent.
When we dive into per-core power loading, we get the following:
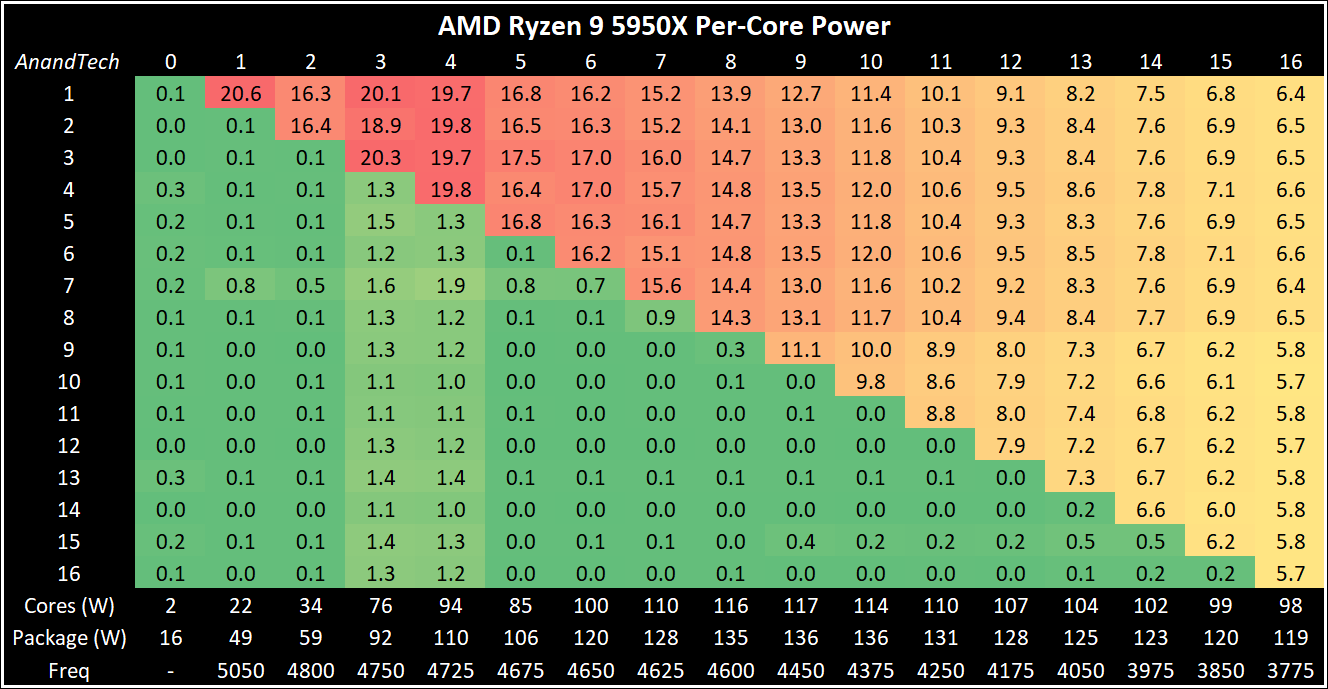
The big chip’s power distribution seems to go up in that 3-4 core loading before coming back down again. But as we load up the second chiplet moving from 8 to 9 core loading, it is worth noting that the second chipset is reporting lower core power, despite showing the same core frequency. AMD is able to supply the two chiplets different amounts of voltage and power, and we might be seeing this play out in real time.
Perhaps very important is that single core power consumption when we are at 5050 MHz of 20.6 W. Going back to our previous generation data, on Zen 2 we were only seeing a peak of 18.3 W, and a slightly higher voltage reported (1.45 V for Zen 2 vs 1.42 V for Zen 3). This means that from the perspective of our two chips, Zen 3 cores scale better in frequency, and even though the power increases as expected, the voltage simultaneously decreases (Note that there can be some silicon variability to also account for some of this.)
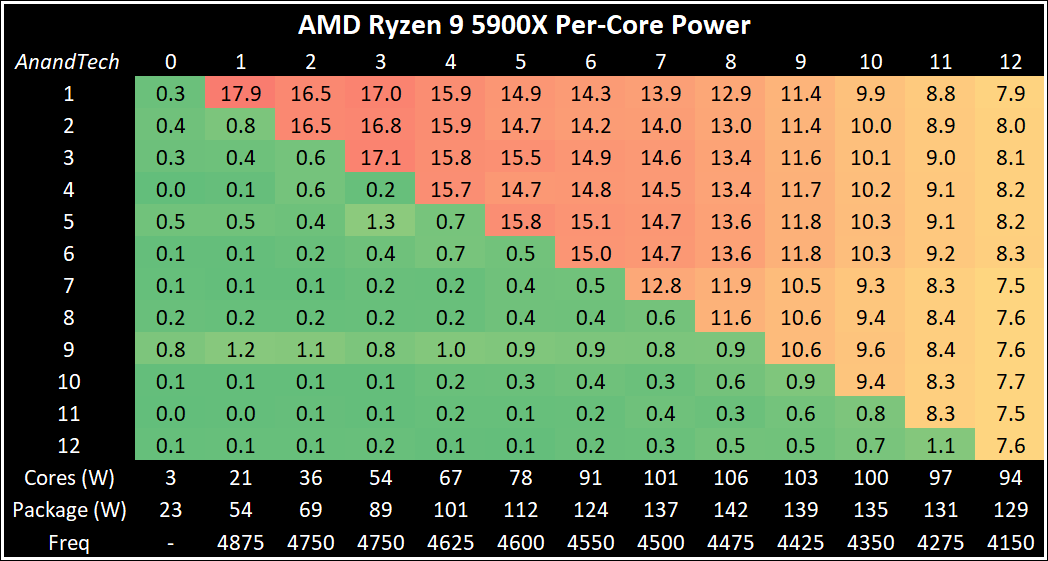
Moving down the stack, the 12-core Ryzen 9 5900X doesn’t show any surprises – we’re seeing the same drop off as we load up the cores, this time as we go beyond eight cores. As this processor uses two chiplets, each with six cores, that second set of six cores seem to be consuming lower power per core as we add in additional load.
Some users might be scratching their heads – why is the second chiplet in both of these chips using less power, and therefore being more efficient? Wouldn’t it be better to use that chiplet as the first chiplet for lower power consumption at low loads? I suspect the answer here is nuanced – this first chipet likely has cores that enable a higher leakage profile, and then could arguably hit the higher frequencies at the expense of the power.
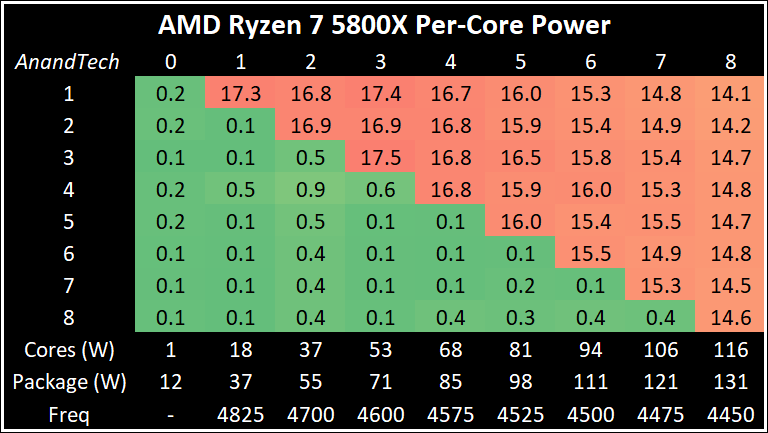
Moving down to a single chiplet but will the full power budget, and there is some power savings by not having the communications of a second chiplet. However, at 8-core load, the 5800X is showing 4450 MHz: the Ryzen 9 processors are showing 4475 MHz and 4500 MHz, indicating that there is still some product differentiation going on with this sort of performance. With this chip we still saw 140 W peak power consumption, however it wasn’t on this benchmark (our peak numbers can come from a number of benchmarks we monitor, not just our power-loading benchmark set).
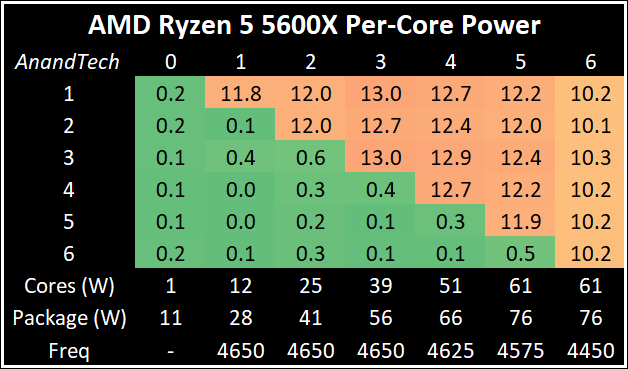
At the 65 W level of the 5600X, as mentioned before, the all-core frequency is 4450 MHz, which is actually 50 MHz behind the 5800X. However this chip is very consistent, still giving up +50 MHz on its peak turbo compared to the on-box number. It also carries this turbo through to at least 3 core loading, and doesn’t lose much to 5 core loading. Users looking for something low power and consistent could be swayed by this chip.
For some specific real-world tests, we’re going to focus solely on the Ryzen 9 5950X. First up is our image-model construction workload, using our Agisoft Photoscan benchmark. This test has a number of different areas that involve single thread, multi-thread, or memory limited algorithms.
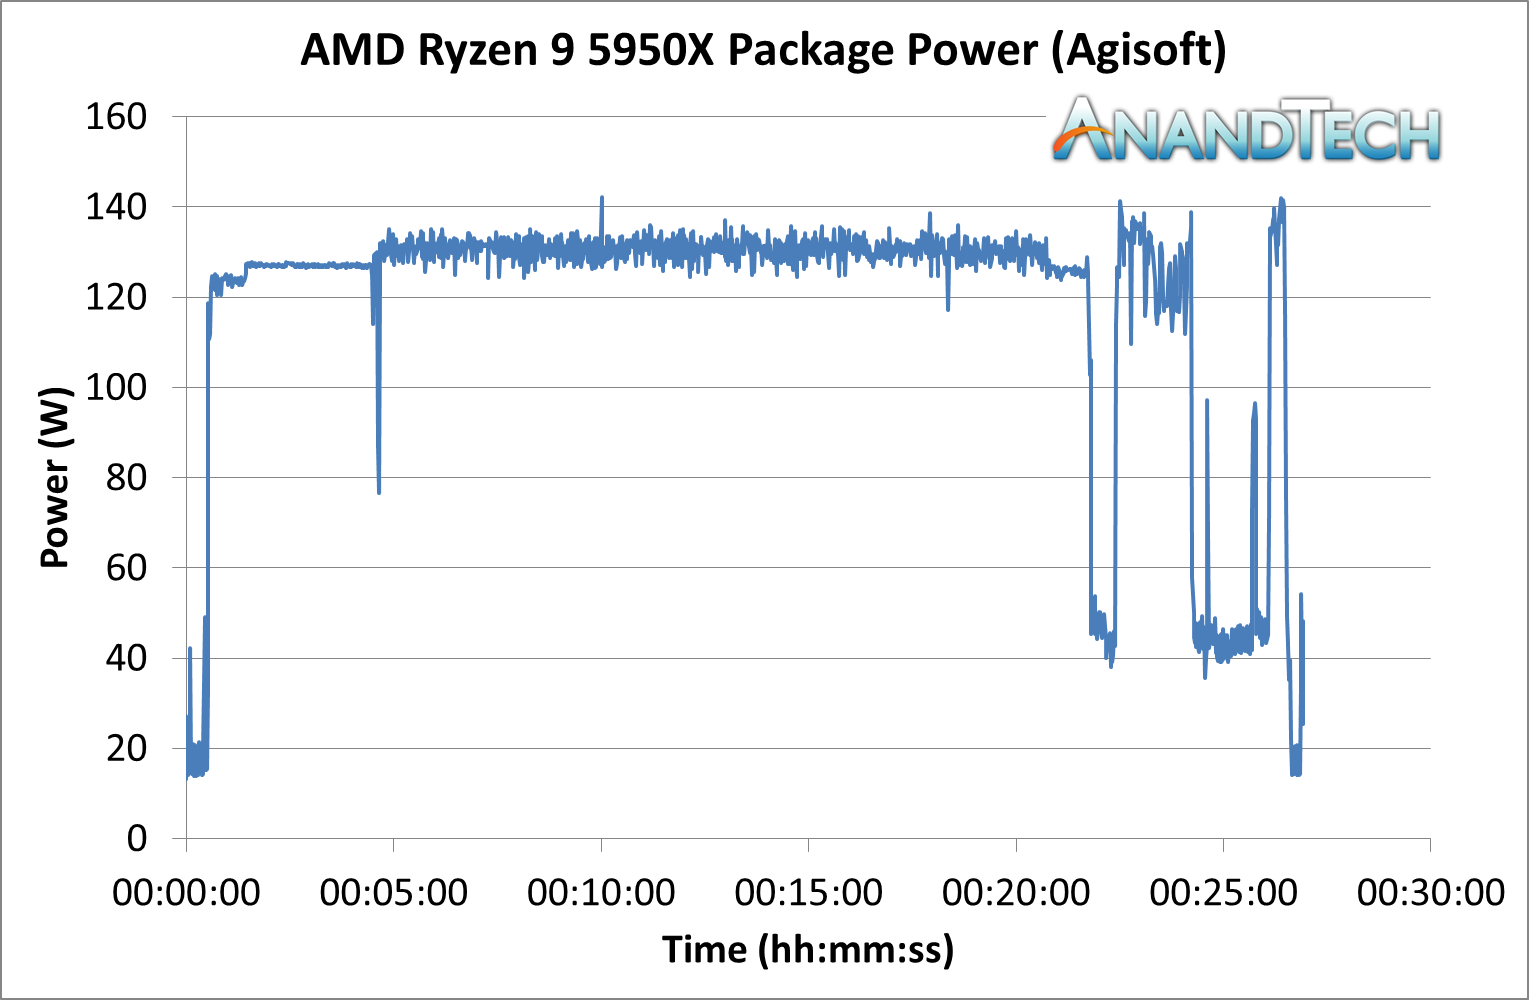
Most of this test sits around the 130 W mark, as the workload has a variable thread count. There are a couple of momentary spikes above 140 W, however everything is well within expected parameters.
The second test is from y-Cruncher, which is our AVX2/AVX512 workload. This also has some memory requirements, which can lead to periodic cycling with systems that have lower memory bandwidth per core options.
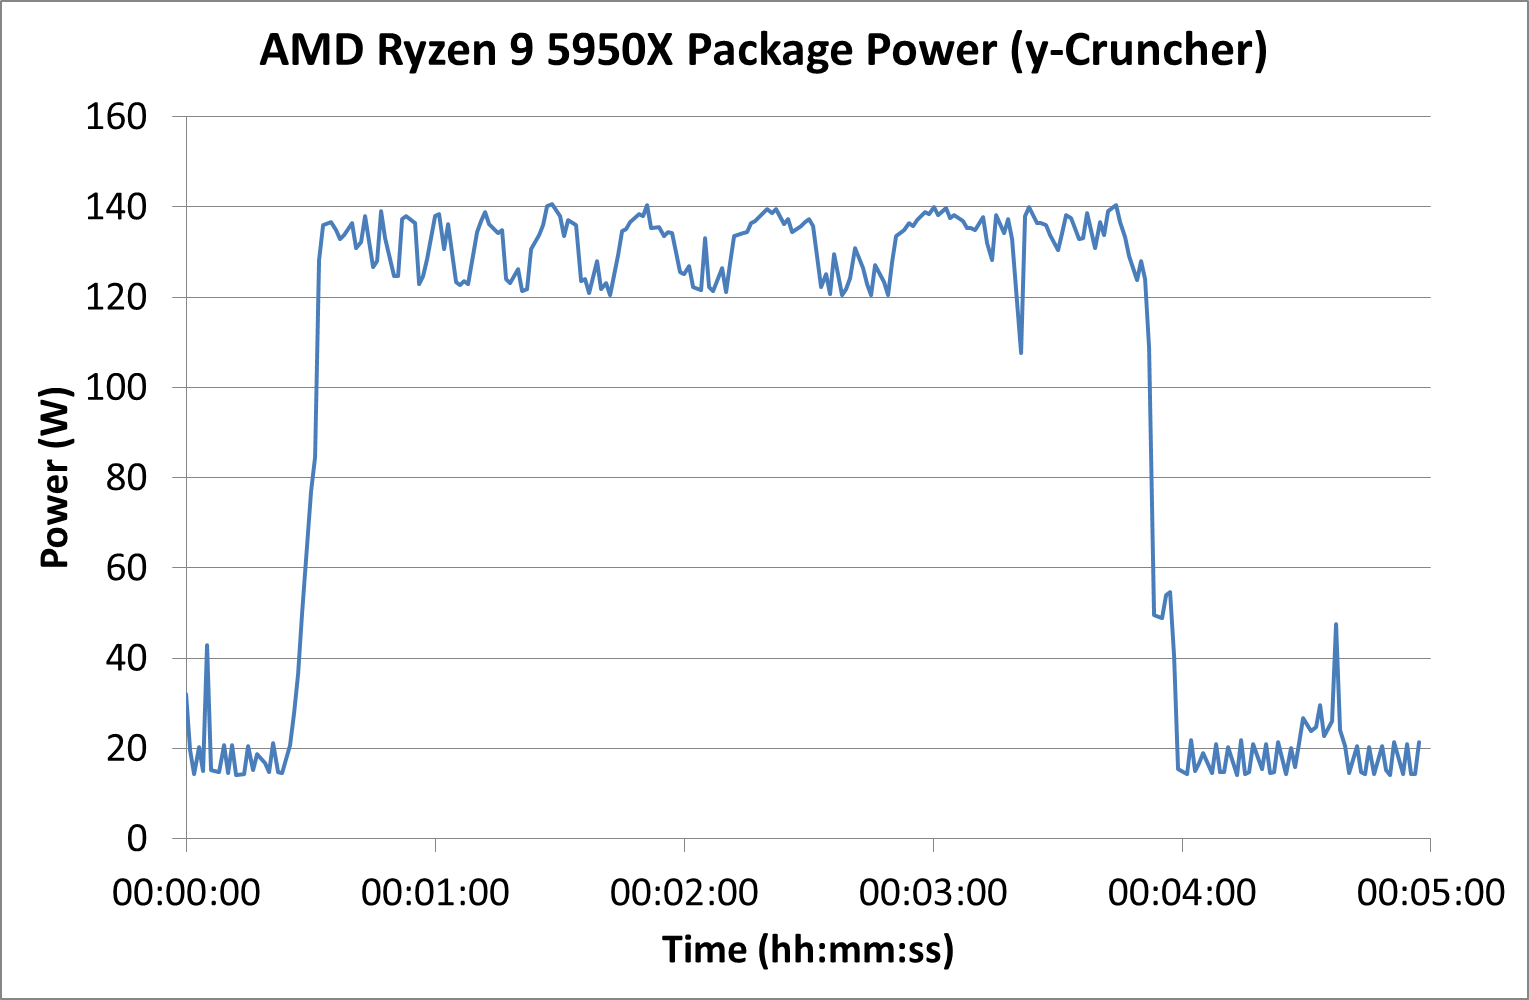
Our y-Cruncher test often shows one of two patterns – either a flat line for power-limited processors, or this zig-zag as the test is loaded and also uses a good portion of memory transfers for the calculation. Usually it is the latter which showcases when we’re getting the most out of the processor, and we get this here.
Compared to other processors, for peak power, we report the highest loaded value observed from any of our benchmark tests.
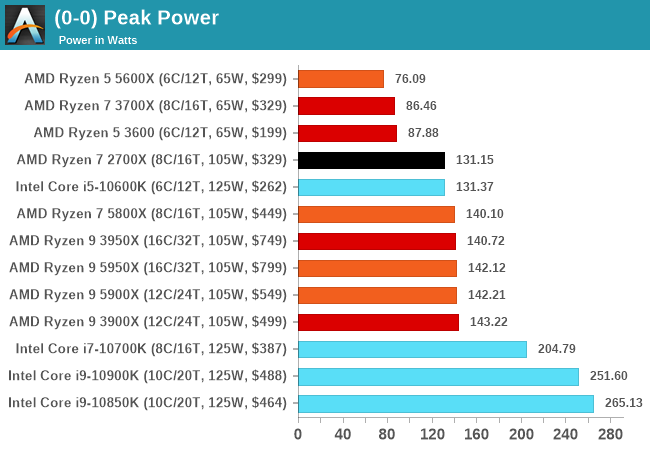
Due to AMD’s PPT implementation, we’re getting very consistent peak power results between multiple generations of AMD processors. Because OEMs play around with Intel’s turbo implementation, essentially to an unlimited peak turbo power, this is why we see full-loaded values well above 200 W. While Intel stays on its most optimized 14nm process and AMD leverages TSMC’s leading 7nm, along with multiple generations of DTCO, AMD will have that efficiency lead.


339 Comments
View All Comments
LithiumFirefly - Friday, November 6, 2020 - link
I thought the whole point to a civilization game benchmark was a time to complete turn not FPS who cares about FPS and a turn-based game.dagobah123 - Friday, November 6, 2020 - link
The more benchmarks the better. These are general purpose CPUs. Wouldn't it be a shame if you bought a 120hz+ 4k monitor with an expensive graphics card, only to find out your CPU was limiting your frames? Sure the game is playable @ 5 FPS as the author mentioned. However, it's getting harder to make the CPU the bottleneck in a lot of these games at higher resolutions and quality settings, so they have to resort to this. Would anyone play a game @ 360p? No, but if you want to see which CPU is better I say lets include every benchmark we can find.CookieBin - Friday, November 6, 2020 - link
I find it funny that these huge gains mean literally nothing at 4K. So all these different review sites highlight sky high fps at 1080p because at 4K that huge advantage becomes less than a 0.3% improvement.. keep pounding sand linus tech tips. I've never seen such a big nothing burger. No idiot out there buys a $800 5950X to play video games at 1080p.chuyayala - Friday, November 6, 2020 - link
The reason they test 1080p is because game processing is CPU-bound at that resolution (they are testing the CPU after-all). The higher the resolution, the more the GPU is working (not the CPU). The reason why there aren't much gains in 4k is because processing is limited by the GPU power. If we assume we get ultra powerful GPUs that can run 4k games at 120+ frames per second, then the CPU becomes more important.dagobah123 - Friday, November 6, 2020 - link
This is simply not true. It only appears to 'mean nothing' if you don't realize the bottleneck in the testing system on most of the benchmarks are the GPU. Meaning the GPU is maxed out at 100%. In this case you're right, the difference between many CPUs will not matter, but what about next year when you decide to buy the next high-end GPU, only to find out the CPU you choose couldn't handle much more. This is why 360p, 720p, even 1080p benchmarks are included to show you just how much more ahead one CPU is over another. Check out the test setup--they are using a 2080 Ti. Come check out the updated reviews after they test all this on 3090s and 6900 XTs.Pit a Ferarri and a Ford Model T against one another. Sure they both keep up with one another in the grocery parking lot @ 15mph. Take em out on the freeway with a 70mph speed limit and you'll have a clear winner. Let alone let em loose on the race track.
Future proof yourself a bit, buy a 5600k or 5800k for your 4k gaming. If you don't update your CPU often you'll be glad you did a couple years out if you drop in that next GPU.
nandnandnand - Saturday, November 7, 2020 - link
5950X will make your web browsing snappier... so you can load more AnandTech ads. ;)zodiacfml - Sunday, November 8, 2020 - link
duh? Steam survey shows 1080p the most popular resolution for gaming. Aside from that, it is difficult to maintain frame rates for 240Hz/360Hz monitors.You might have a point with 720p res though
realbabilu - Friday, November 6, 2020 - link
First: I think you should compare with F or KF Intel version, for price comparison. Since they don't have internal Gpu. Somehow AMD not included the FAN also, beware good cooling isn't cheap.SECOND: it's nice to had coding bench with optimization here windows, with AVX2 and some flags compiling, Amd only provide optimization compiling on Linux only, I think they should be on windows too with optimized math kernel and compiler.
ThIrd: the price performance is justified now. In zen2 release the price was lower than Intel that time, made Intel justified the price for 10th Gen. Now from price sensitive, Intel still fine per price / performance ratio,even though it's need more power consumption.
duploxxx - Saturday, November 7, 2020 - link
the ryzens have a base TDP of 105W and peaking towards 140-150Wnot like the intels that peak at +200ish W, there you need good cooling.
A Dark rock slim or shadow rock can easily handle this and it will cost you 50-60$..
go find a cooler for the +200W so that it wont throttle all the time for the Intel
realbabilu - Saturday, November 7, 2020 - link
Great. I think Anand tech should do cooling shootout for 5900x/5950x bench.To find the minimum air cooler for this,
AMD only list noctua and bequiet as air cooler, others as liquid cooler at https://www.amd.com/en/processors/ryzen-thermal-so...
The slim rock and nh14s maybe the cheapest on the list. It is interesting could more budget double fan tower should enough for 5900x/5950x that has 145 watt max like deepcool gammax 400 pro (double fan), coolermaster ma410p, and shadow rock 2/3, and maybe cheapest aio coolermaster liquid master 120 lite that not listed on amd list.