AMD’s Mobile Revival: Redefining the Notebook Business with the Ryzen 9 4900HS (A Review)
by Dr. Ian Cutress on April 9, 2020 9:00 AM ESTASUS Zephyrus G14: Battery, Display, and Storage
Battery Life
One of the key elements in the AMD Ryzen Mobile 4000 story is that we should finally have a product that offers a decent amount of battery life. AMD’s previous notebooks, even those with Zen mobile processors inside from last year, have been behind Intel equivalent designs by a margin that the market has been uncomfortable with. Every user gets some degree of battery anxiety, myself included. AMD believes that the new Ryzen Mobile 4000 story fixes this quite substantially.
I should note that up until today, I have used almost exclusively Intel laptops, mainly because they have been the ones that fit my needs. Performance and portability have always been key, plus the thin and light ultraportable designs have offered great battery life and fast charging, especially when flying around the world. The only time I don’t get battery anxiety is with an Arm based laptop, which I can charge and still have battery two to three days later depending on use, but then I’m trading performance and usability to get that. Whatever AMD and its partners had offered up to this point would not fit the bill without compromises, so naturally most users have been skeptical when AMD has started to say that it can match Intel’s battery life performance now.
The best way to find out is by doing some battery tests. Our comparison points here are:
| ASUS Zephyrus G14 vs Razer Blade 15 | ||
| ASUS Zephyrus G14 |
AnandTech | Razer Blade 15-inch |
| Ryzen 9 4900 HS | CPU | Core i7-9750H |
| RTX 2060 (Max-Q) | GPU | RTX 2060 |
| 16 GB DDR4-3200 | DRAM | 16 GB DDR4-2666 |
| 1 TB Intel 660p | Storage | 512 GB Liteon CA3 |
| 1080p @ 120 Hz | Resolution | 1080p @ 144 Hz |
| Wi-Fi 6 | Wi-Fi | Wi-Fi 5 |
| 76 Wh | Battery Size | 80 Wh |
For our battery tests, we set both panels to 200 nits, place the systems in battery saver mode, and make sure all updates are applied to both. For our offline video test, Wi-Fi is disabled.
First up is our video test. For this, we run a H.264 encoded version of a popular 2h30 film on repeat in the native Films & TV application in Windows 10. This film is fairly dimly lit in general, which can sometimes have a beneficial effect on battery life.
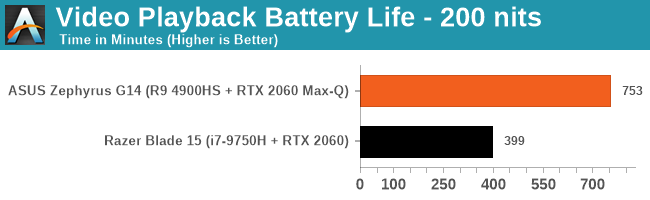
Well that’s pretty succinct. Our Razer Blade manages 6 hours and 39 minutes, while the ASUS Zephyrus G14 does 12 hours and 33 minutes. That’s not quite double, but that’s a step function above and beyond what I expected. Dang.
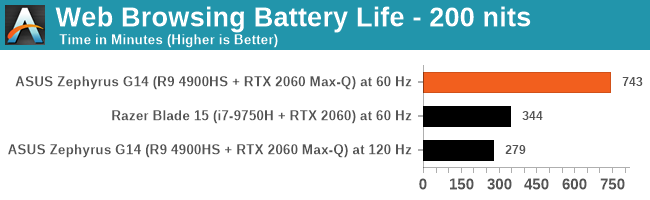
For our web test, we run a script that loads fixed variants of popular websites featuring a wide variety of capabilities. This is web loading rather than browsers processing and computing data, and into the mix we make the mouse scroll up and down as well.
The Razer Blade achieved 5h44, which is around what we expected given the video test. The G14, on our first run, only got 4h39, which was a lot lower than expected. We performed the test multiple times, with roughly the same results. We pinged AMD to find out if they had experienced like it, and they could not reproduce it – their own data suggests around a 9 hour design.
It took a few days to figure it out, but I think I found the answer.
Both of our laptops have variable refresh rate displays that go above 60 Hz. These high refresh rate displays are meant to kick in when going beyond 60 Hz will make a material difference to the experience, such as gaming. When watching a film, it doesn’t make a difference, so it should be sat at 60 Hz. When word processing or reading email, again these do not need >60 Hz, so the feature should be off.
However, web browsing is a little bit different, and this is where users are going to see a difference in battery tests for this device. If a web browsing battery test simply loads websites and sits there looking at what pops up, then sure, the screen can stay at 60 Hz. But the moment you start scrolling, going beyond 60 Hz actually makes a difference to the experience – if the system can go beyond 60 Hz, it should.
So theoretically, both of our systems should have been running their screens at the higher variable refresh rates, simply because our web tests initiates scrolling every time it loads a new page. There are some idle spots, so we are about 50% idle and 50% scrolling, which is a fair mix. Now, when a system is on wall power, you expect all the bells and whistles like peak turbo and variable refresh rate to be enabled, but when going off of power, it is up to the laptop vendor to decide which features you should keep.
With the Razer Blade, it was clear that the system was forced into a 60 Hz only mode, the discrete GPU gets shut down, and power is saved. However for the ASUS, that doesn’t seem to be the case. The system was still polling above 60 Hz, which was causing the discrete GPU inside to fire up. This meant that instead of having a system power around 4 W or so, we were getting a system power of 21 W, because that RTX 2060 Max Q was up and running.
Now, AMD did not find this issue because it looks like their ASUS G14 units internally were actually turning off the high refresh rate for their web tests. So perhaps my sample is a dud in that respect, or in my own meddling I had somehow disabled this particular feature (which to be honest, is well within the realms of possibility). In the end, I decided to manually put the system into power saver mode, and turn the display back to 60 Hz, and I reran the test. Nice and simple, and the data showed a 12hr23 battery life. Which is a very crazy high battery life for an AMD system.
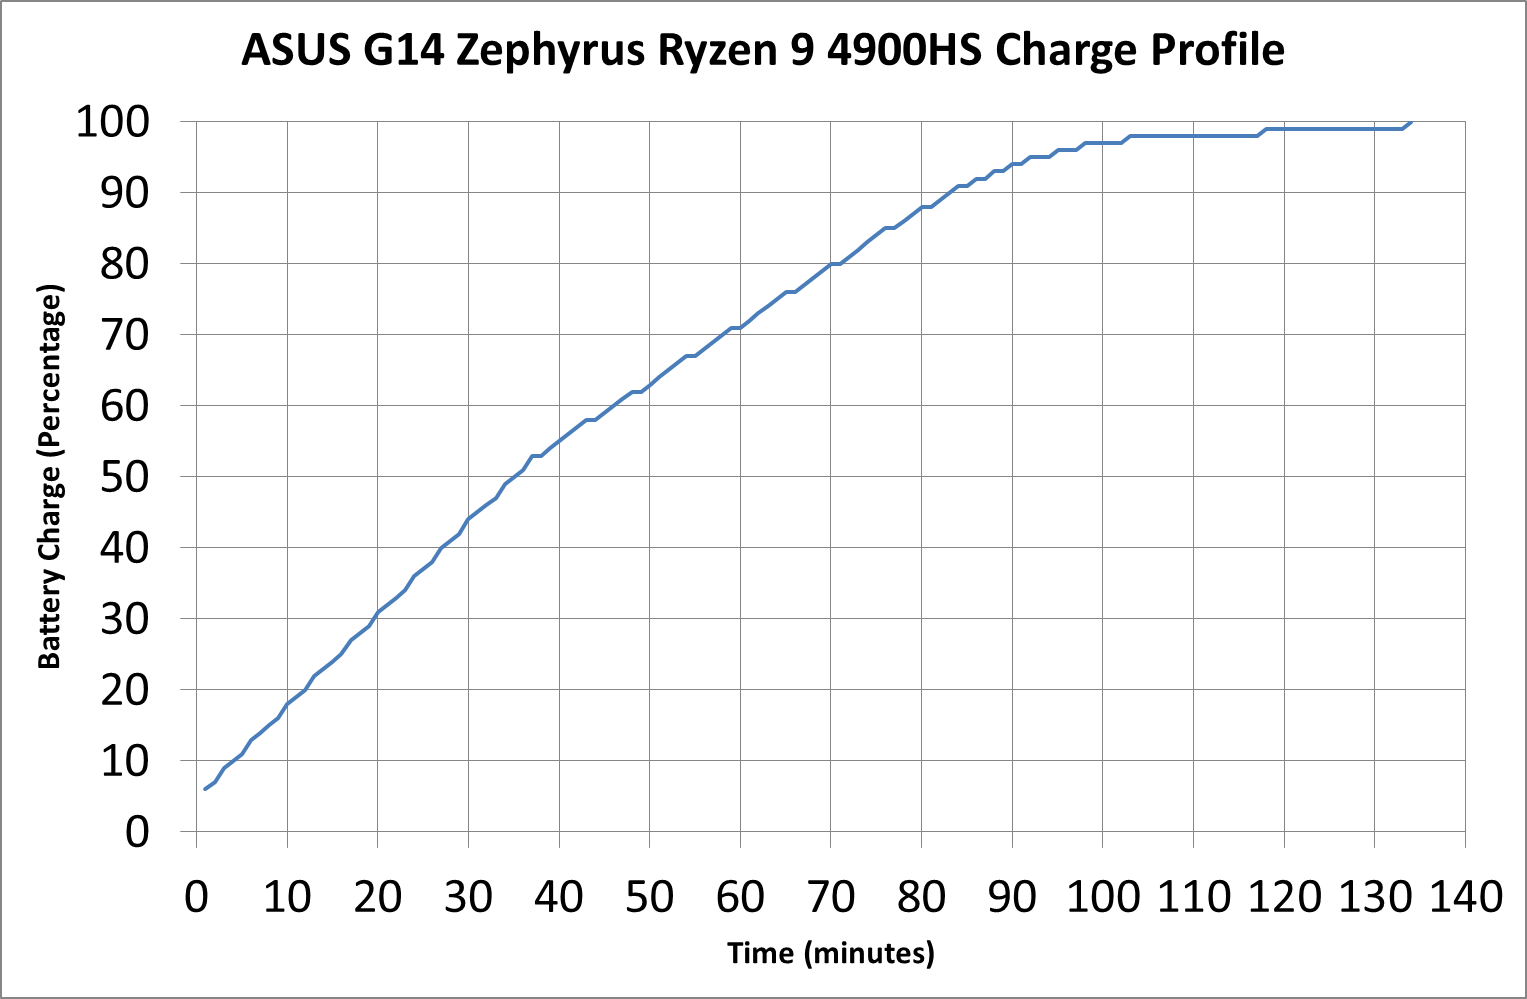
On charging, when using the 180 W charger, the AMD system in 30 minutes went from 6% battery to 44%, in 60 minutes it went from 6% to 72%, and by 83 minutes it was at 90%. The last 10 percent almost took another hour.
Display
For the Zephyrus G14, there are three options for the display:
- 1920x1080 IPS, 60 Hz, 100% sRGB
- 1920x1080 IPS, 120 Hz, Adaptive Sync, 100% sRGB
- 2560x1440 IPS, 60 Hz, Adaptive Sync, 100% sRGB
In our units, we were given devices with the middle display, offering 120 Hz. ASUS lists the displays as having a peak brightness of 300 nits, which is a little low, even with higher refresh rate displays and 100% sRGB calibration. In our testing, we only achieved 260 nits peak brightness (full screen white), with a 0.189 nits on a dark screen.
Nonetheless, it was clear that this display had been color calibrated. With our i1 Display Pro, the color accuracy was top notch.
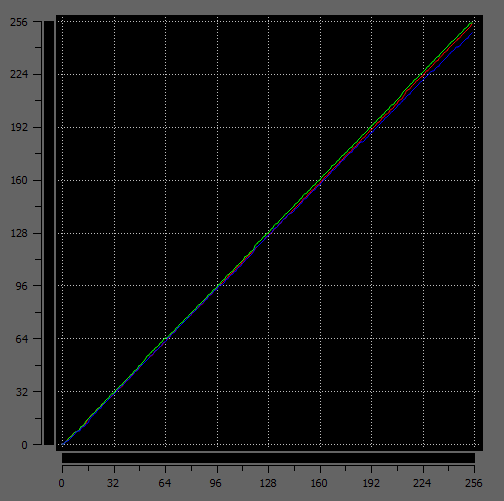
As we ramp up the colors, the biggest deviations from the norm are the blues, but by a small fraction.
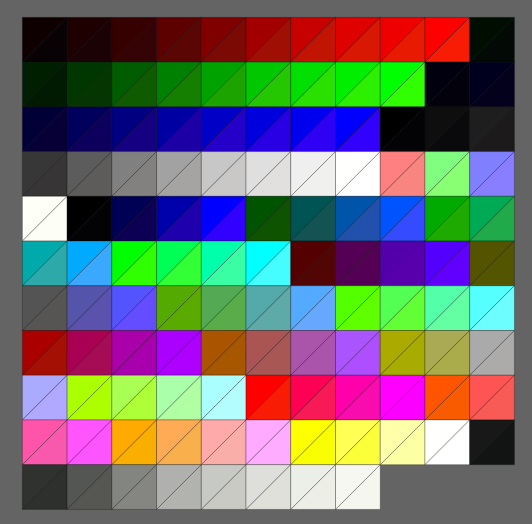
Doing a direct color analysis, and there’s some mild variation in the greens in the center of this image, and the stronger blues. The latter half of the third row is showing where the blues are the weakest, but despite that, the whole set looks very good.
Storage
ASUS is set to offer this unit at around the $1450 mark, and with that comes a 1 TB NVMe PCIe 3.0 x4 drive. This is double the size of the 512 GB NVMe PCIe 3.0 x4 drive that comes in the $1679 Razer Blade, which sounds like a bargain. However, the Razer does win on performance.
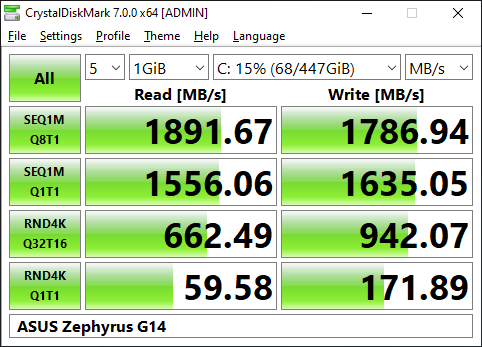
The ASUS Zephyrus G14 uses the Intel 660p drive, which is an 2280 M.2 drive with a Silicon Motion SM2263 drive with 256 MB of DRAM and Intel 64L QLC memory. Despite the PCIe 3.0 x4 specifications, in this system it only hits ~1900 MB/s peak sequential reads and ~1800 MB/s peak sequential writes.
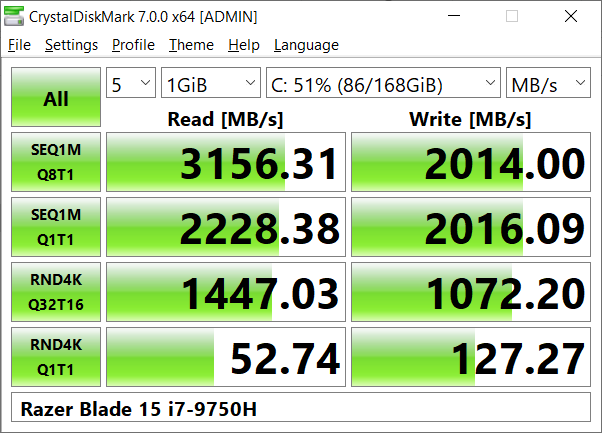
The Razer Blade uses a 512 GB PCIe 3.0 x4 NVMe drive from LiteOn, specifically the CA3. This uses a Marvell 88SS1093 controller with DRAM and is paired with Toshiba’s 3D TLC NAND. TLC should have a performance advantage over the QLC, and that is probably what we’re seeing here on the Razer. There’s a sizable jump in the sequential tests and the high queue depth random tests, however the low queue depth test is actually better on the Intel drive inside the ASUS.


267 Comments
View All Comments
Curiousland - Sunday, April 12, 2020 - link
US is adding more restrictions on TSMC to ship chips to Hwawei which is one of the biggest 7nm and 5nm customers of TSMC. So like it or not TSMC will have a lot more capacity and to rely on AMD's business. So, yeah, TSMC and AMD will work more closely ever before.https://www.cnbc.com/2020/03/27/us-prepares-crackd...
Namisecond - Tuesday, April 14, 2020 - link
Like your article link says, that's more likely to hurt TSMC and it's western customers like AMD, Nvidia and Apple more than it will Huawei. At this point, I don't think it's going to happen. Even if it does, it won't affect contracts already in place and products already in production. Remember, 18 month lead time.JayNor - Sunday, April 12, 2020 - link
this is partially an Intel product, and they thank you." a 1 TB Intel 660p NVMe SSD, and an Intel Wi-Fi 6 solution."
dguy6789 - Tuesday, April 14, 2020 - link
What do you mean? Intel's 9900K is faster than anything AMD has in gaming including AMD's 4 grand CPU. And that is just 14nm vs 7nm.AMD won't have a better gaming CPU than the 9900K 2 years from now.
Qasar - Tuesday, April 14, 2020 - link
and the 9900k only has the performance lead for one reason, clock speed, which is the only reason intel has any performance lead right now, while using more power to get that performance. clock the cpus at the same speed, and see what happens.schujj07 - Tuesday, April 14, 2020 - link
Outside of gaming, the 3700X performs as good or better than the 9900k more often than not, all while the 9900k draws a massive 60% more power. In gaming benchmarks the 9900k is ahead by about 5% at 1080p using a 2080Ti. At that point it is the difference between 300fps & 315fps. No way that you or I will ever be able to tell the difference.schujj07 - Tuesday, April 14, 2020 - link
Edit: The 9900k has a 3.6GHz base and 5GHz boost clock. 3700X has 3.6GHz base and 4.4GHz boost. Even with a 13.5% higher boost clock, see typically in single threaded applications, the 9900k is only barely able to beat out the 3700X in some single threaded applications. Difference is usually 3% on average. Normalized for clock speed Zen 2 has about an 8% IPC advantage over Sky Lake and its derivatives.marrakech - Sunday, November 8, 2020 - link
https://www.dell.com/en-nz/work/shop/workstations/...https://www.cpubenchmark.net/compare/Intel-Xeon-W-...
marrakech - Sunday, November 8, 2020 - link
nice prediction ,just as an information i seen some dude soend 6000 $ for an intel xeon w workstation the best 8 core mobile intel and its still slower then my 4800H cpu
total cost of laptop after ram upgrade 1180$
jgood13 - Monday, February 22, 2021 - link
I don't think this is going to prove to be true...