Amazon's Arm-based Graviton2 Against AMD and Intel: Comparing Cloud Compute
by Andrei Frumusanu on March 10, 2020 8:30 AM EST- Posted in
- Servers
- CPUs
- Cloud Computing
- Amazon
- AWS
- Neoverse N1
- Graviton2
SPEC - MT Performance (16xlarge 64vCPU)
While the core scaling figures are interesting from an academical standpoint, what’s even more interesting is seeing the absolute throughput numbers compared to the competition. We’re starting off with SPECrate results with 64-rate runs, fully utilising the vCPUs of the EC2 16xlarge instances.
Again, there’s the conundrum of the apples-and-oranges comparison between the Graviton2’s 64 physical cores versus the 32 cores plus SMT setups of the AMD and Intel platforms, but again, that’s how Amazon is positioning these systems in terms of throughput capacity and instance pricing. You could argue that if you can parallelise your workload above a certain amount of threads, it doesn’t matter on whether you can achieve the higher throughput through more cores or through mechanisms such as SMT. Remember, when talking about silicon die area, you could at minimum probably fit 2 N1 cores in the same area than an AMD Zen core or an Intel core (probably an even higher number in the latter comparison).
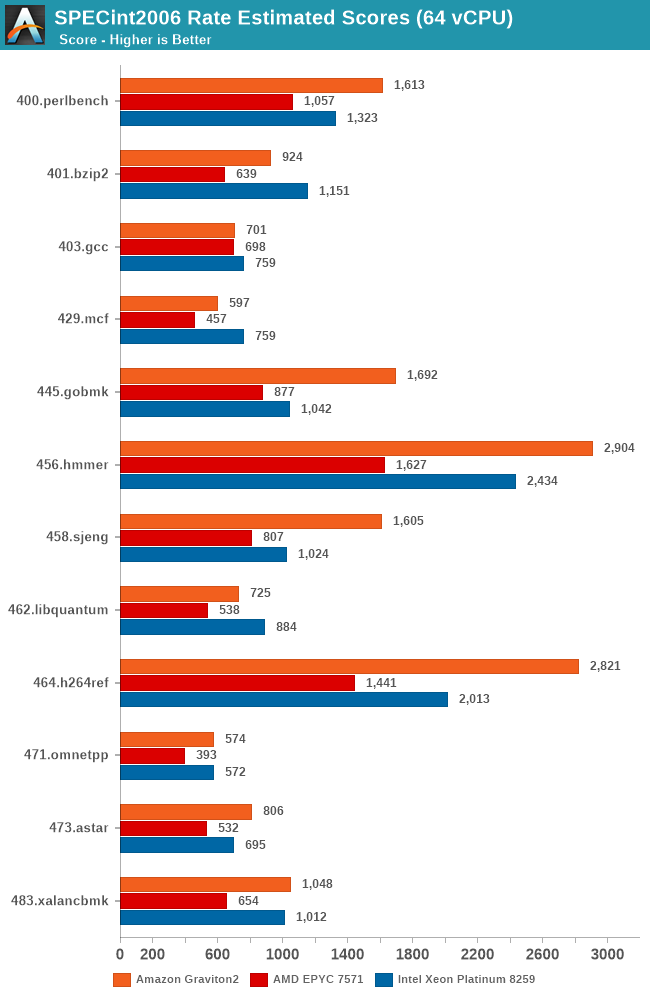
The Graviton2’s performance is absolutely impressive across the board, beating the Intel Cascade Lake system by quite larger margins in a lot of the workloads. AMD’s Epyc system here doesn’t fare well at all and is showing its age.
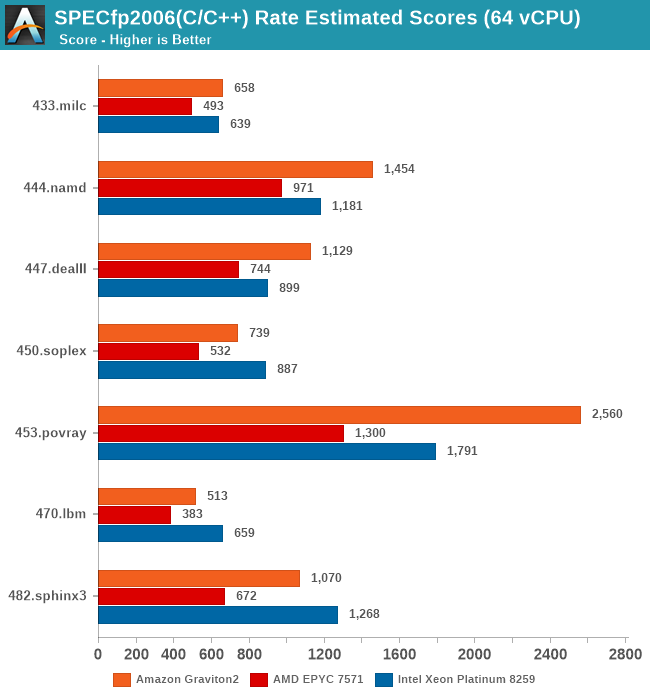
It’s particularly in the non-memory bound workloads that the Graviton2 manages to position itself significantly ahead, and here the advantage of having a two-fold physical core lead with essentially double the execution resources shows its benefits.
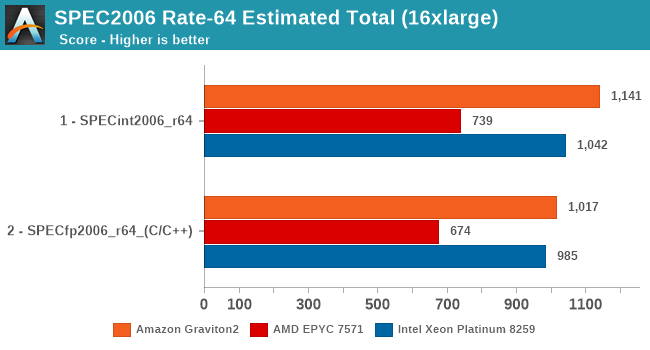
In the overall SPECrate2006 results, the Graviton2 is shy of Arm’s projection of a 1300 score, but again the Amazon chip does clock in a bit lower and has less cache than what Arm had envisioned in their presentations a year ago.
Nevertheless, the Graviton2 has the performance lead here even against the Intel Cascade Lake based EC2 instances, which is quite surprising given the latter’s cost structure, and indicator of what to come later in the cost analysis.
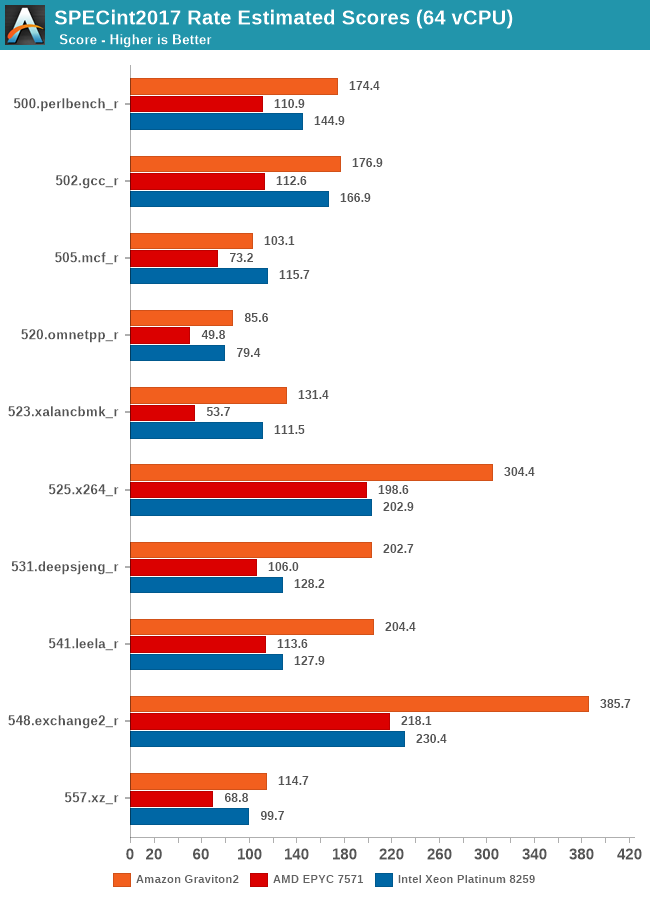
Arm’s physical core count advantage here continues to show in the execution intensive workloads of SPECint2017, showcasing some very large performance leads in many workloads. The performance leap on important workloads such as 502.gcc again isn’t too great over the Intel system for example – Amazon and Arm definitely could do better here if the chip would have had more cache available.
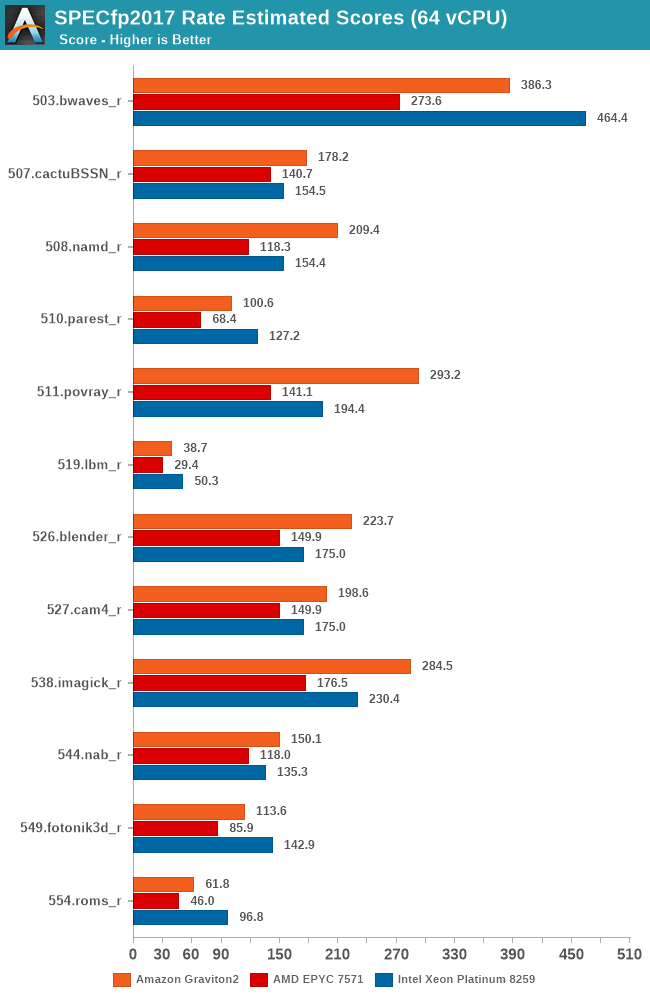
In SPECfp2017, there’s more workloads in which the Xeon system’s 2-socket setup with a 50% memory channel advantage does show up, able to result in more available bandwidth and thus give the more memory intensive workloads in this suite a good performance advantage over the Graviton2 system. Still, the Arm chip fares very competitively and does put the older AMD EPYC processor in its place, and yes again, we have to remind ourselves that things would be quite different here if we’d be able to include Rome in our charts.
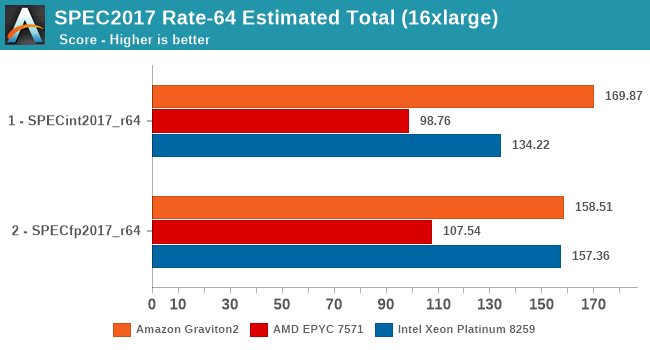
Overall, the Graviton2 system has an undisputed lead in the SPECint2017 suite, whilst just edging out on average the Xeon system in the FP suite, only losing out in situations where the Xeon’s higher memory bandwidth comes at play.


96 Comments
View All Comments
imaskar - Friday, June 12, 2020 - link
There's a major flaw in the price comparison - why did they take m5n (which has additional network quota) instead of regular m5? It would be $3.07 instead $3.808BlueLikeYou - Tuesday, September 1, 2020 - link
Maybe I'm missing something, but the SPEC numbers seem a little low compared to published results. For example, an Intel Xeon Platinum 8260 scores around 280ish for 48 cores on SPEC INT RATE 2017. This chip is pretty similar to an 8259CL, except that the 8259CL has a slightly higher frequency at 2.5 GHz vs 2.4 GHz for the 8260.The m5n.16xlarge has 32 cores. (32/48) * 280 = 187.67. Your result was 157.36; about 83% of my guess. Granted, performance will probably not scale exactly linearly and there may be a little virtualization overhead, but that drop still seems a little steep.
sgovindan - Friday, June 25, 2021 - link
Hi Andrei,I'm trying to replicate your PMBW bandwidth numbers on the AWS with a C6G instance, but I seem to be getting lower BW estimates - ~170 GB/s for the scalar reads (64-bit) and ~160 GB/s for scalar writes for 64 threads. I've tried both 64GB and 1 GB as the test sizes (the -s and -S parameters of PMBW). Could you confirm the test sizes and/or command-lines used for your results? Thanks.