The Snapdragon 865 Performance Preview: Setting the Stage for Flagship Android 2020
by Andrei Frumusanu on December 16, 2019 7:30 AM EST- Posted in
- Mobile
- Qualcomm
- Smartphones
- 5G
- Cortex A77
- Snapdragon 865
GPU Performance & Power
On the GPU side of things, testing the QRD865 is a bit complicated as we simply didn’t have enough time to run the device through our usual test methodology where we stress both peak as well as sustained performance of the chip. Thus, the results we’re able to present today solely address the peak performance characteristics of the new Adreno 650 GPU.
Disclaimer On Power: As with the CPU results, the GPU power measurements on the QRD865 are not as high confidence as on a commercial device, and the preliminary power and efficiency figures posted below might differ in final devices.
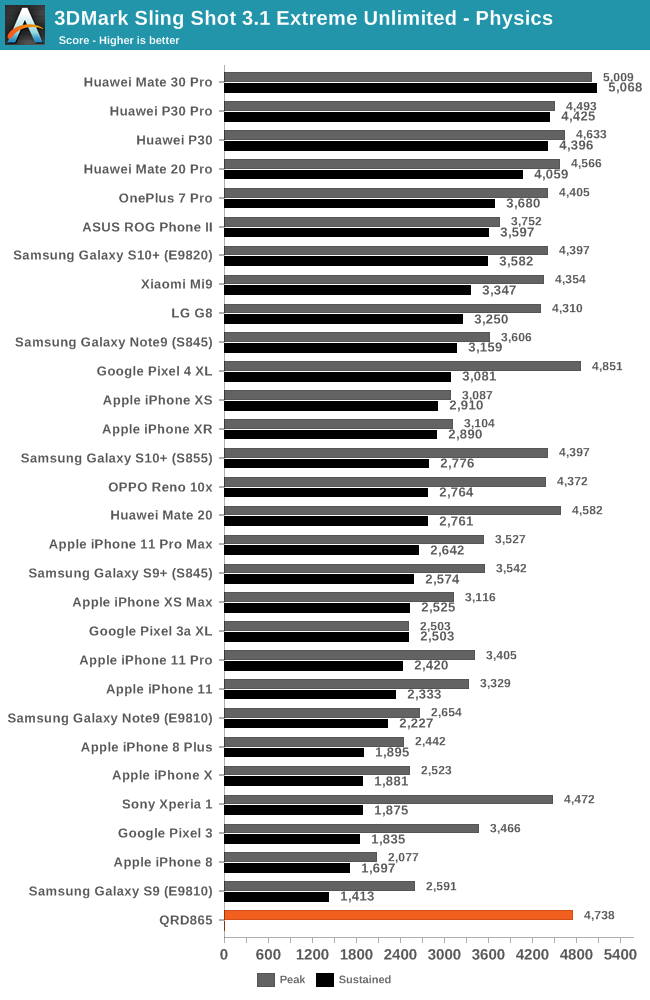
The 3DMark Physics tests is a CPU-bound benchmark within a GPU power constrained scenario. The QRD865 here oddly enough doesn’t showcase major improvements compared to its predecessor, in some cases actually being slightly slower than the Pixel 4 XL and also falling behind the Kirin 990 powered Mate 30 Pro even though the new Snapdragon has a microarchitectural advantage. It seems the A77 does very little in terms of improving the bottlenecks of this test.
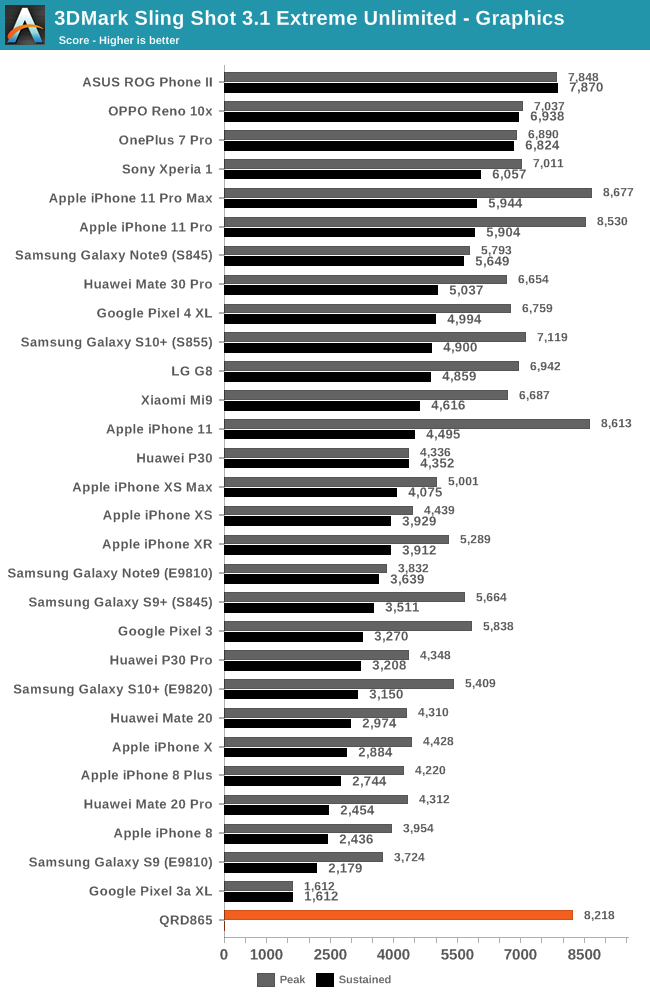
In the 3DMark Graphics test, the QRD865 results are more in line with what we expect of the GPU. Depending on which S855 you compare to, we’re seeing 15-22% improvements in the peak performance.
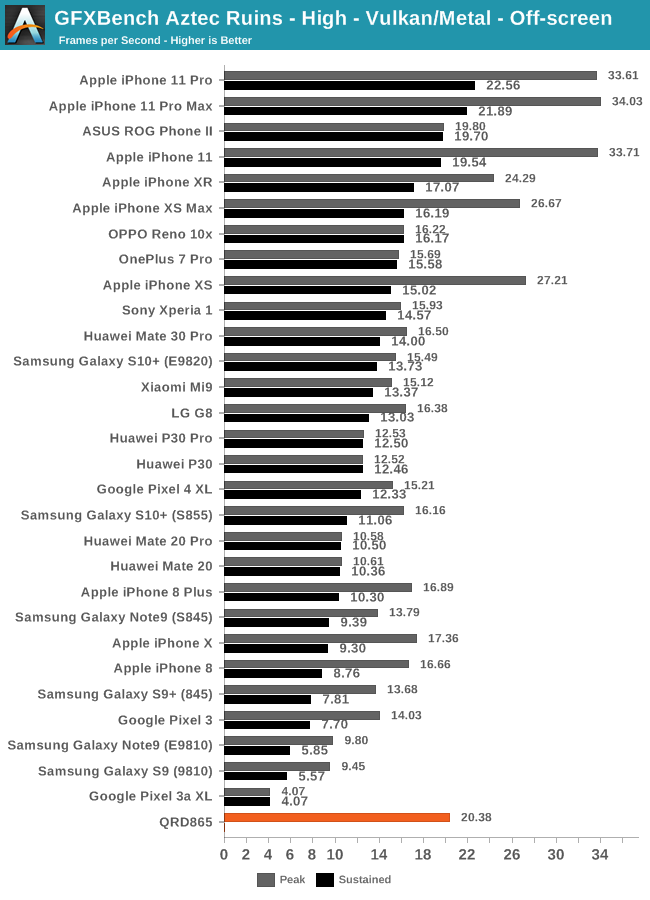
In the GFXBench Aztec High benchmark, the improvement over the Snapdragon 855 is roughly 26%. There’s one apparent issue here when looking at the chart rankings; although there’s an improvement in the peak performance, the end result is that the QRD865 still isn’t able to reach the sustained performance of Apple’s latest A13 phones.
| GFXBench Aztec High Offscreen Power Efficiency (System Active Power) |
||||
| Mfc. Process | FPS | Avg. Power (W) |
Perf/W Efficiency |
|
| iPhone 11 Pro (A13) Warm | N7P | 26.14 | 3.83 | 6.82 fps/W |
| iPhone 11 Pro (A13) Cold / Peak | N7P | 34.00 | 6.21 | 5.47 fps/W |
| iPhone XS (A12) Warm | N7 | 19.32 | 3.81 | 5.07 fps/W |
| iPhone XS (A12) Cold / Peak | N7 | 26.59 | 5.56 | 4.78 fps/W |
| QRD865 (Snapdragon 865) | N7P | 20.38 | 4.58 | 4.44 fps/W |
| Mate 30 Pro (Kirin 990 4G) | N7 | 16.50 | 3.96 | 4.16 fps/W |
| Galaxy 10+ (Snapdragon 855) | N7 | 16.17 | 4.69 | 3.44 fps/W |
| Galaxy 10+ (Exynos 9820) | 8LPP | 15.59 | 4.80 | 3.24 fps/W |
Looking at the estimated power draw of the phone, it indeed does look like Qualcomm has been able to sustain the same power levels as the S855, but the improvements in performance and efficiency here aren’t enough to catch up to either the A12 or A13, with Apple being both ahead in terms of performance, power and efficiency.
| GFXBench Aztec Normal Offscreen Power Efficiency (System Active Power) |
||||
| Mfc. Process | FPS | Avg. Power (W) |
Perf/W Efficiency |
|
| iPhone 11 Pro (A13) Warm | N7P | 73.27 | 4.07 | 18.00 fps/W |
| iPhone 11 Pro (A13) Cold / Peak | N7P | 91.62 | 6.08 | 15.06 fps/W |
| iPhone XS (A12) Warm | N7 | 55.70 | 3.88 | 14.35 fps/W |
| iPhone XS (A12) Cold / Peak | N7 | 76.00 | 5.59 | 13.59 fps/W |
| QRD865 (Snapdragon 865) | N7P | 53.65 | 4.65 | 11.53 fps/W |
| Mate 30 Pro (Kirin 990 4G) | N7 | 41.68 | 4.01 | 10.39 fps/W |
| Galaxy 10+ (Snapdragon 855) | N7 | 40.63 | 4.14 | 9.81 fps/W |
| Galaxy 10+ (Exynos 9820) | 8LPP | 40.18 | 4.62 | 8.69 fps/W |
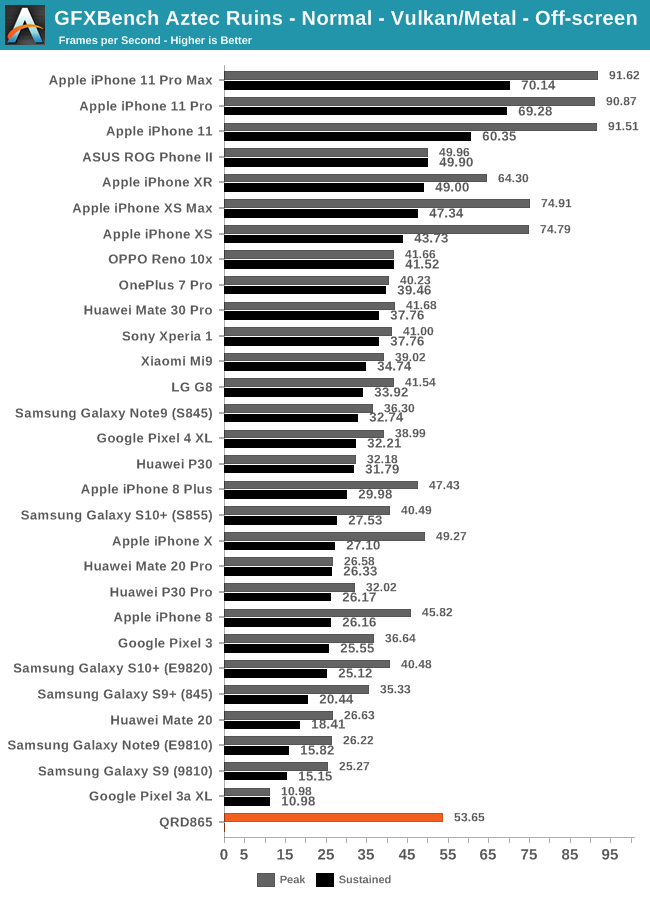
We’re seeing a similar scenario in the Normal variant of the Aztec test. Although the performance improvements here do match the promised figures, it’s not enough to catch up to Apple’s two latest SoC generations.
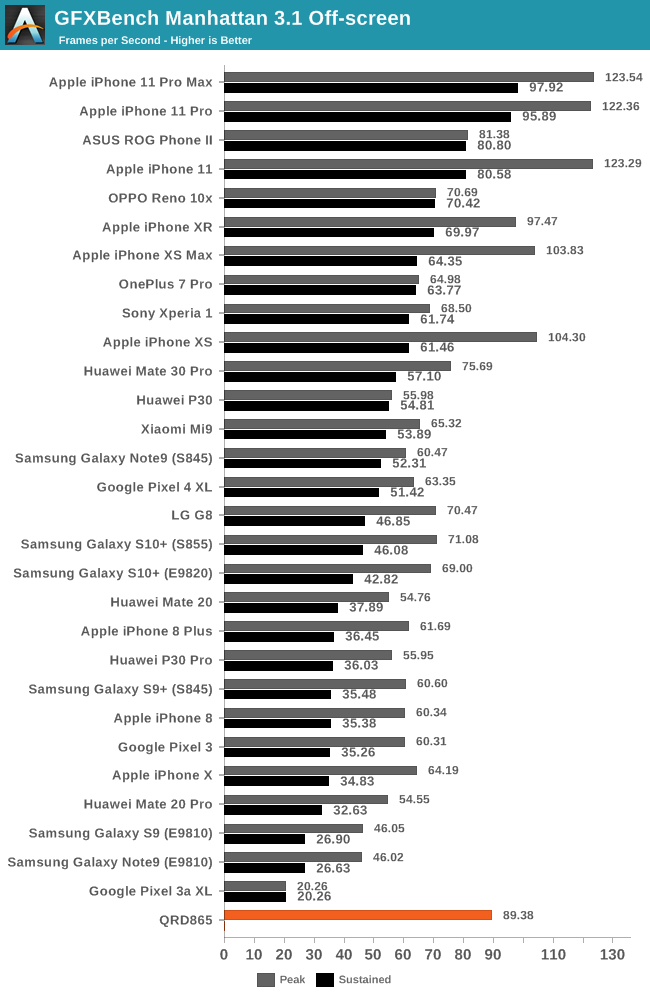
| GFXBench Manhattan 3.1 Offscreen Power Efficiency (System Active Power) |
||||
| Mfc. Process | FPS | Avg. Power (W) |
Perf/W Efficiency |
|
| iPhone 11 Pro (A13) Warm | N7P | 100.58 | 4.21 | 23.89 fps/W |
| iPhone 11 Pro (A13) Cold / Peak | N7P | 123.54 | 6.04 | 20.45 fps/W |
| iPhone XS (A12) Warm | N7 | 76.51 | 3.79 | 20.18 fps/W |
| iPhone XS (A12) Cold / Peak | N7 | 103.83 | 5.98 | 17.36 fps/W |
| QRD865 (Snapdragon 865) | N7P | 89.38 | 5.17 | 17.28 fps/W |
| Mate 30 Pro (Kirin 990 4G) | N7 | 75.69 | 5.04 | 15.01 fps/W |
| Galaxy 10+ (Snapdragon 855) | N7 | 70.67 | 4.88 | 14.46 fps/W |
| Galaxy 10+ (Exynos 9820) | 8LPP | 68.87 | 5.10 | 13.48 fps/W |
| Galaxy S9+ (Snapdragon 845) | 10LPP | 61.16 | 5.01 | 11.99 fps/W |
| Mate 20 Pro (Kirin 980) | N7 | 54.54 | 4.57 | 11.93 fps/W |
| Galaxy S9 (Exynos 9810) | 10LPP | 46.04 | 4.08 | 11.28 fps/W |
| Galaxy S8 (Snapdragon 835) | 10LPE | 38.90 | 3.79 | 10.26 fps/W |
| Galaxy S8 (Exynos 8895) | 10LPE | 42.49 | 7.35 | 5.78 fps/W |
Even on the more traditional tests such as Manhattan 3.1, although again the Adreno 650 is able to showcase good improvements this generation, it seems that Qualcomm didn’t aim quite high enough.
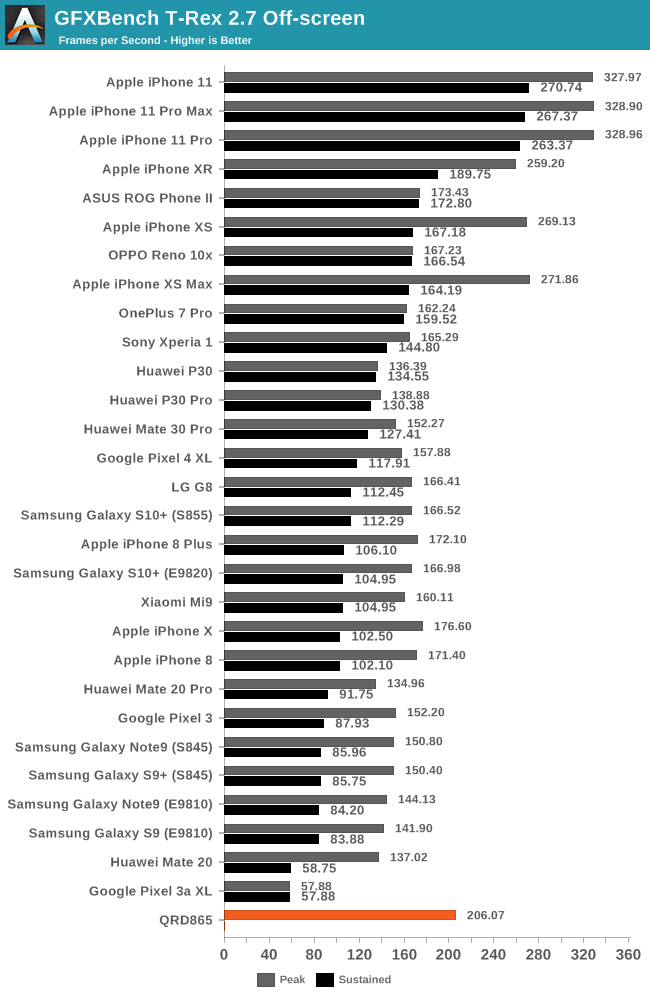
| GFXBench T-Rex Offscreen Power Efficiency (System Active Power) |
||||
| Mfc. Process | FPS | Avg. Power (W) |
Perf/W Efficiency |
|
| iPhone 11 Pro (A13) Warm | N7P | 289.03 | 4.78 | 60.46 fps/W |
| iPhone 11 Pro (A13) Cold / Peak | N7P | 328.90 | 5.93 | 55.46 fps/W |
| iPhone XS (A12) Warm | N7 | 197.80 | 3.95 | 50.07 fps/W |
| iPhone XS (A12) Cold / Peak | N7 | 271.86 | 6.10 | 44.56 fps/W |
| QRD865 (Snapdragon 865) | N7P | 206.07 | 4.70 | 43.84 fps/W |
| Galaxy 10+ (Snapdragon 855) | N7 | 167.16 | 4.10 | 40.70 fps/W |
| Mate 30 Pro (Kirin 990 4G) | N7 | 152.27 | 4.34 | 35.08 fps/W |
| Galaxy S9+ (Snapdragon 845) | 10LPP | 150.40 | 4.42 | 34.00 fps/W |
| Galaxy 10+ (Exynos 9820) | 8LPP | 166.00 | 4.96 | 33.40fps/W |
| Galaxy S9 (Exynos 9810) | 10LPP | 141.91 | 4.34 | 32.67 fps/W |
| Galaxy S8 (Snapdragon 835) | 10LPE | 108.20 | 3.45 | 31.31 fps/W |
| Mate 20 Pro (Kirin 980) | N7 | 135.75 | 4.64 | 29.25 fps/W |
| Galaxy S8 (Exynos 8895) | 10LPE | 121.00 | 5.86 | 20.65 fps/W |
Lastly, the T-Rex benchmark which is the least compute heavy workload tested here, and mostly is bottlenecked by texture and fillrate throughput, sees a 23% increase for the Snapdragon 865.
Overall GPU Conclusion – Good Improvements – Competitively Not Enough
Overall, we were able to verify the Snapdragon 865’s performance improvements and Qualcomm’s 25% claims seem to be largely accurate. The issue is that this doesn’t seem to be enough to keep up with the large improvements that Apple has been able to showcase over the last two generations.
During the chipset’s launch, Qualcomm was eager to mention that their product is able to showcase better long-term sustained performance than a competitor which “throttles within minutes”. While we don’t have confirmation as to whom exactly they were referring to, the data and narrative here only matches Apple’s device behaviour. Whilst we weren’t able to test the sustained performance of the QRD865 today, it unfortunately doesn’t really matter for Qualcomm as the Snapdragon 865 and Adreno 650’s peak performance falls in at a lower level than Apple’s A13 sustained performance.
Apple isn’t the only one Qualcomm has to worry about; the 25% performance increases this generation are within reach of Arm’s Mali-G77. In theory, Samsung’s Exynos 990 should be able to catch up with the Snapdragon 865. Qualcomm had been regarded as the mobile GPU leader over the last few years, but it’s clear that development has slowed down quite a lot recently, and the Adreno family has lost its crown.


178 Comments
View All Comments
yankeeDDL - Tuesday, December 17, 2019 - link
No, I was looking at the Web benchmarks. All of them are miserable compared even to the iPhone X.And Web browsing is certainly a key part of mobile experience.
joms_us - Tuesday, December 17, 2019 - link
And yet in real world comparison, iPhone is faster only in handful of sites (excluding apple.com LOL) by millisec. Does that look miserable to you? =DNicon0s - Tuesday, December 17, 2019 - link
Yes and have you actually seen an Android flagship that performs noticeably worse than an iphone(any iphone) in web browsing? Because I sure haven't.What I have seen is Android phones with better connection speed and better reception in general, especial in crowded places like concerts, stadiums, subways etc. In those places the performance from the iphone x was actually 0 in many instances because there was no signal. If we are talking about the mobile experience let's not ignore the Modem.
s.yu - Tuesday, December 17, 2019 - link
"If we are talking about the mobile experience let's not ignore the Modem."And there are connectivity tests for that, although controlling variables in a connectivity test is almost impossible outside of lab conditions.
Ultimately these are separate tests and test entirely different aspects. You're free to test both, but if you try to test them simultaneously outputting one single result, you will obtain one worthless data point.
Wilco1 - Tuesday, December 17, 2019 - link
Synthetic browsing benchmarks depend highly on software implementation and tuning, so they are not useful to compare CPU performance.yeeeeman - Tuesday, December 17, 2019 - link
A bit MEH...Alistair - Tuesday, December 17, 2019 - link
The Android fanatics are out tonight. I only buy Android phones, period. Clearly Apple's CPUs are miles ahead in performance. Anyone use the latest iPad Pro? It's faster than any Windows laptop I've bought or used personally. Boss gave us the latest and greatest dual core HP ultra slim laptop, and I immediately replaced it with a Ryzen 8 core computer and said "I don't use laptops for real work". We don't need benchmarks to tell us how fast Apple's CPUs are (though Andrei's benchmarks are perfectly valid), it is immediately apparent when comparing vs. similarly clocked Intel products. The reasons Ryzen and Intel seem great right now are high clocks and many cores. Run your 9900k in 2 core mode, at 2.6 Ghz and squirm at its low speed. That's what the iPhone uses, a low clocked dual core. Put 8 together, and run it at 4 Ghz, and you have a monster.id4andrei - Tuesday, December 17, 2019 - link
You're forgetting a stripped down mobile OS and relatively stripped down mobile apps that are part of the speed equation.Alistair - Tuesday, December 17, 2019 - link
that has nothing to do with it, that's what I'm saying, that's what Andrei is sayingAlistair - Tuesday, December 17, 2019 - link
the other Andrei lol