The Snapdragon 865 Performance Preview: Setting the Stage for Flagship Android 2020
by Andrei Frumusanu on December 16, 2019 7:30 AM EST- Posted in
- Mobile
- Qualcomm
- Smartphones
- 5G
- Cortex A77
- Snapdragon 865
GPU Performance & Power
On the GPU side of things, testing the QRD865 is a bit complicated as we simply didn’t have enough time to run the device through our usual test methodology where we stress both peak as well as sustained performance of the chip. Thus, the results we’re able to present today solely address the peak performance characteristics of the new Adreno 650 GPU.
Disclaimer On Power: As with the CPU results, the GPU power measurements on the QRD865 are not as high confidence as on a commercial device, and the preliminary power and efficiency figures posted below might differ in final devices.
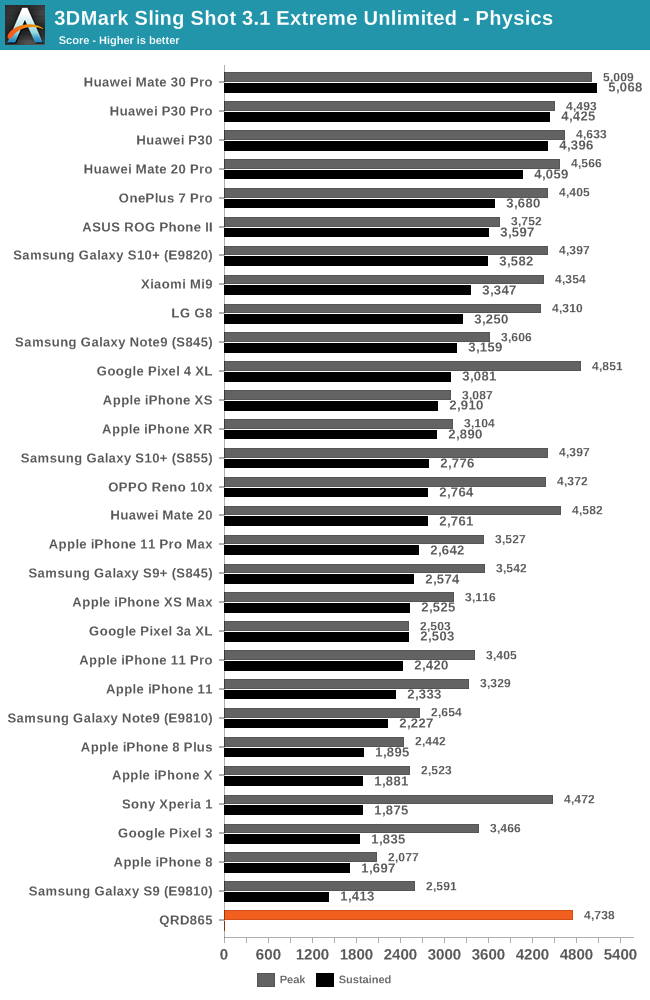
The 3DMark Physics tests is a CPU-bound benchmark within a GPU power constrained scenario. The QRD865 here oddly enough doesn’t showcase major improvements compared to its predecessor, in some cases actually being slightly slower than the Pixel 4 XL and also falling behind the Kirin 990 powered Mate 30 Pro even though the new Snapdragon has a microarchitectural advantage. It seems the A77 does very little in terms of improving the bottlenecks of this test.
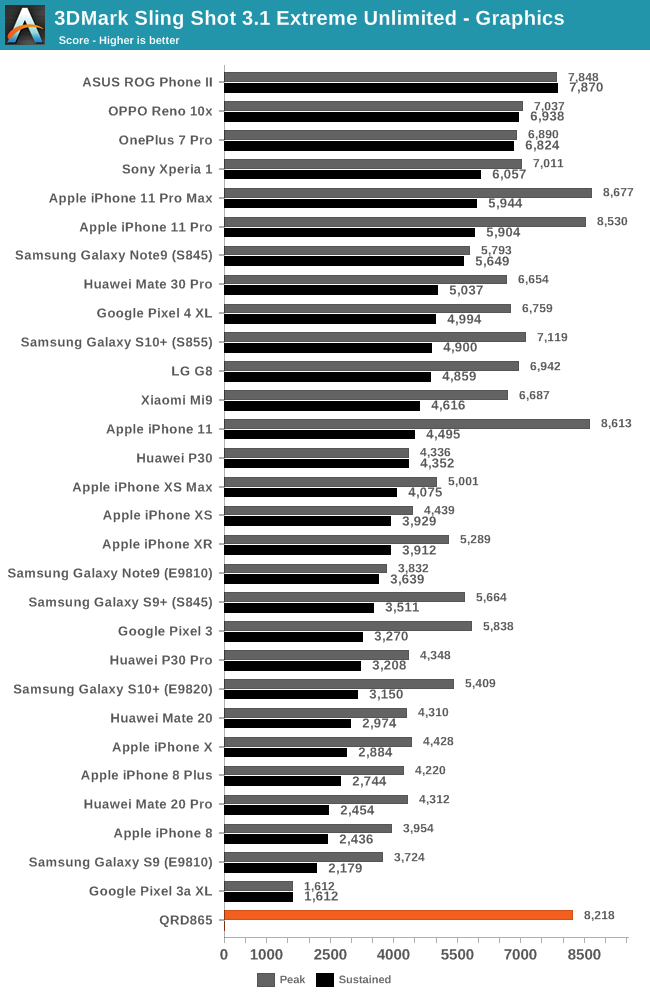
In the 3DMark Graphics test, the QRD865 results are more in line with what we expect of the GPU. Depending on which S855 you compare to, we’re seeing 15-22% improvements in the peak performance.
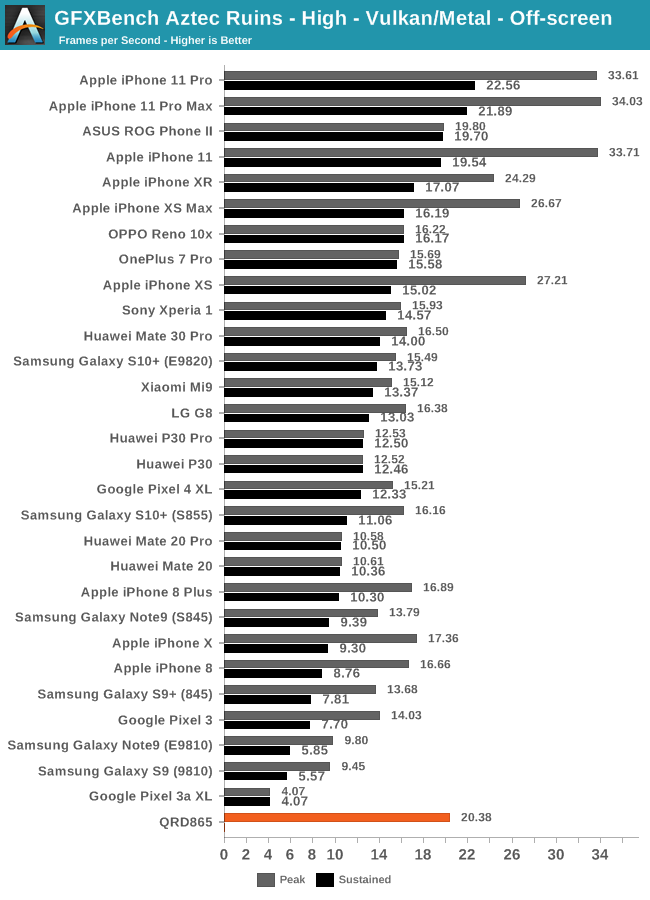
In the GFXBench Aztec High benchmark, the improvement over the Snapdragon 855 is roughly 26%. There’s one apparent issue here when looking at the chart rankings; although there’s an improvement in the peak performance, the end result is that the QRD865 still isn’t able to reach the sustained performance of Apple’s latest A13 phones.
| GFXBench Aztec High Offscreen Power Efficiency (System Active Power) |
||||
| Mfc. Process | FPS | Avg. Power (W) |
Perf/W Efficiency |
|
| iPhone 11 Pro (A13) Warm | N7P | 26.14 | 3.83 | 6.82 fps/W |
| iPhone 11 Pro (A13) Cold / Peak | N7P | 34.00 | 6.21 | 5.47 fps/W |
| iPhone XS (A12) Warm | N7 | 19.32 | 3.81 | 5.07 fps/W |
| iPhone XS (A12) Cold / Peak | N7 | 26.59 | 5.56 | 4.78 fps/W |
| QRD865 (Snapdragon 865) | N7P | 20.38 | 4.58 | 4.44 fps/W |
| Mate 30 Pro (Kirin 990 4G) | N7 | 16.50 | 3.96 | 4.16 fps/W |
| Galaxy 10+ (Snapdragon 855) | N7 | 16.17 | 4.69 | 3.44 fps/W |
| Galaxy 10+ (Exynos 9820) | 8LPP | 15.59 | 4.80 | 3.24 fps/W |
Looking at the estimated power draw of the phone, it indeed does look like Qualcomm has been able to sustain the same power levels as the S855, but the improvements in performance and efficiency here aren’t enough to catch up to either the A12 or A13, with Apple being both ahead in terms of performance, power and efficiency.
| GFXBench Aztec Normal Offscreen Power Efficiency (System Active Power) |
||||
| Mfc. Process | FPS | Avg. Power (W) |
Perf/W Efficiency |
|
| iPhone 11 Pro (A13) Warm | N7P | 73.27 | 4.07 | 18.00 fps/W |
| iPhone 11 Pro (A13) Cold / Peak | N7P | 91.62 | 6.08 | 15.06 fps/W |
| iPhone XS (A12) Warm | N7 | 55.70 | 3.88 | 14.35 fps/W |
| iPhone XS (A12) Cold / Peak | N7 | 76.00 | 5.59 | 13.59 fps/W |
| QRD865 (Snapdragon 865) | N7P | 53.65 | 4.65 | 11.53 fps/W |
| Mate 30 Pro (Kirin 990 4G) | N7 | 41.68 | 4.01 | 10.39 fps/W |
| Galaxy 10+ (Snapdragon 855) | N7 | 40.63 | 4.14 | 9.81 fps/W |
| Galaxy 10+ (Exynos 9820) | 8LPP | 40.18 | 4.62 | 8.69 fps/W |
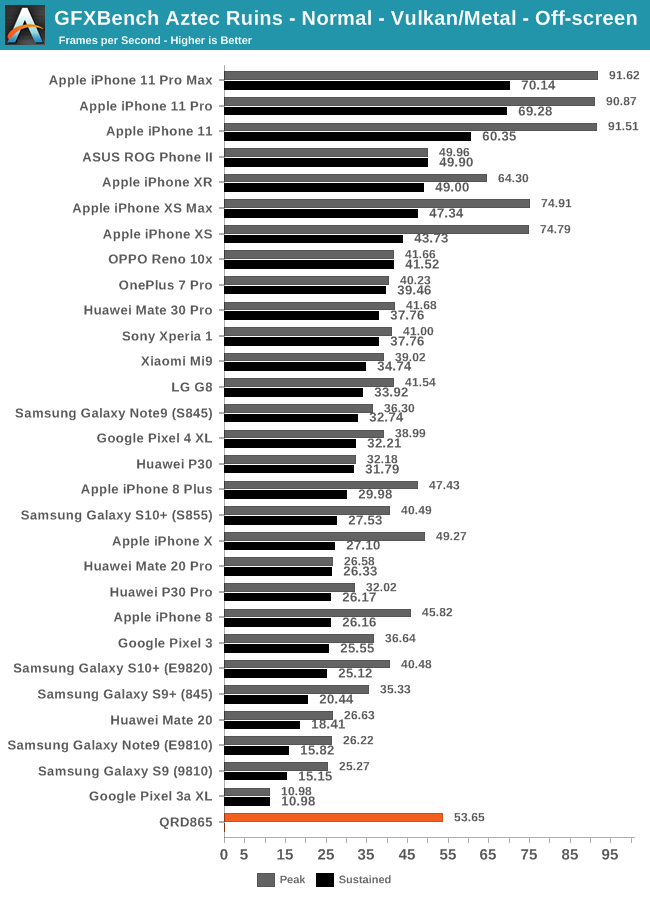
We’re seeing a similar scenario in the Normal variant of the Aztec test. Although the performance improvements here do match the promised figures, it’s not enough to catch up to Apple’s two latest SoC generations.
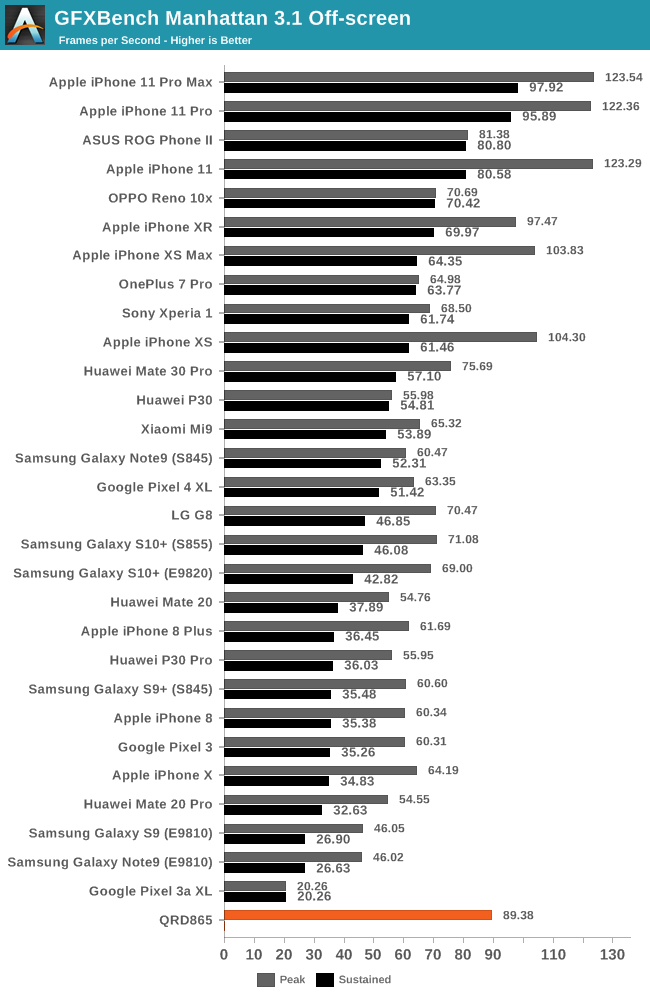
| GFXBench Manhattan 3.1 Offscreen Power Efficiency (System Active Power) |
||||
| Mfc. Process | FPS | Avg. Power (W) |
Perf/W Efficiency |
|
| iPhone 11 Pro (A13) Warm | N7P | 100.58 | 4.21 | 23.89 fps/W |
| iPhone 11 Pro (A13) Cold / Peak | N7P | 123.54 | 6.04 | 20.45 fps/W |
| iPhone XS (A12) Warm | N7 | 76.51 | 3.79 | 20.18 fps/W |
| iPhone XS (A12) Cold / Peak | N7 | 103.83 | 5.98 | 17.36 fps/W |
| QRD865 (Snapdragon 865) | N7P | 89.38 | 5.17 | 17.28 fps/W |
| Mate 30 Pro (Kirin 990 4G) | N7 | 75.69 | 5.04 | 15.01 fps/W |
| Galaxy 10+ (Snapdragon 855) | N7 | 70.67 | 4.88 | 14.46 fps/W |
| Galaxy 10+ (Exynos 9820) | 8LPP | 68.87 | 5.10 | 13.48 fps/W |
| Galaxy S9+ (Snapdragon 845) | 10LPP | 61.16 | 5.01 | 11.99 fps/W |
| Mate 20 Pro (Kirin 980) | N7 | 54.54 | 4.57 | 11.93 fps/W |
| Galaxy S9 (Exynos 9810) | 10LPP | 46.04 | 4.08 | 11.28 fps/W |
| Galaxy S8 (Snapdragon 835) | 10LPE | 38.90 | 3.79 | 10.26 fps/W |
| Galaxy S8 (Exynos 8895) | 10LPE | 42.49 | 7.35 | 5.78 fps/W |
Even on the more traditional tests such as Manhattan 3.1, although again the Adreno 650 is able to showcase good improvements this generation, it seems that Qualcomm didn’t aim quite high enough.
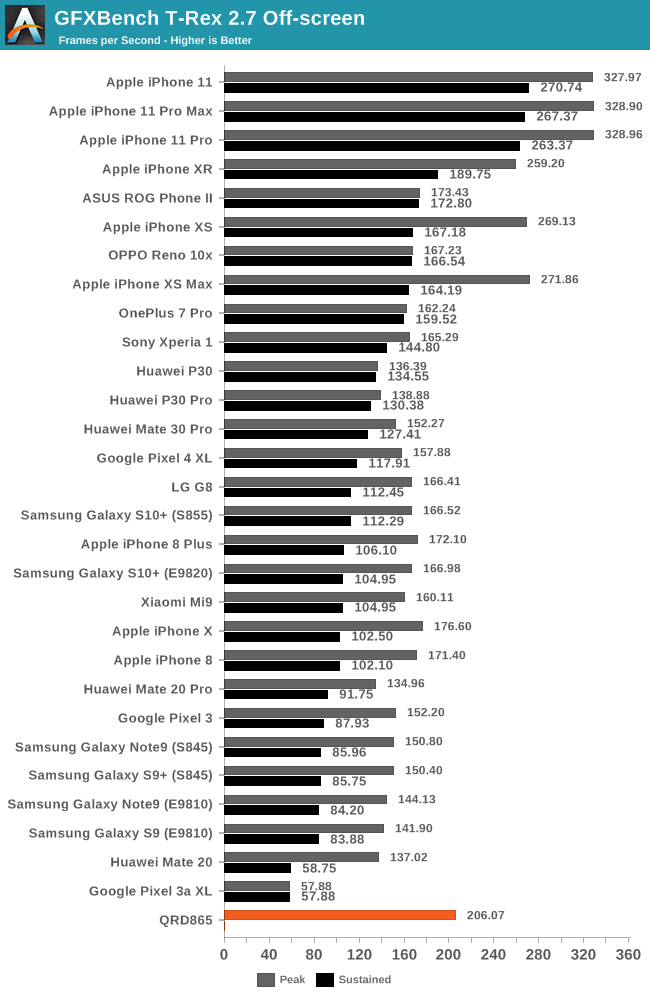
| GFXBench T-Rex Offscreen Power Efficiency (System Active Power) |
||||
| Mfc. Process | FPS | Avg. Power (W) |
Perf/W Efficiency |
|
| iPhone 11 Pro (A13) Warm | N7P | 289.03 | 4.78 | 60.46 fps/W |
| iPhone 11 Pro (A13) Cold / Peak | N7P | 328.90 | 5.93 | 55.46 fps/W |
| iPhone XS (A12) Warm | N7 | 197.80 | 3.95 | 50.07 fps/W |
| iPhone XS (A12) Cold / Peak | N7 | 271.86 | 6.10 | 44.56 fps/W |
| QRD865 (Snapdragon 865) | N7P | 206.07 | 4.70 | 43.84 fps/W |
| Galaxy 10+ (Snapdragon 855) | N7 | 167.16 | 4.10 | 40.70 fps/W |
| Mate 30 Pro (Kirin 990 4G) | N7 | 152.27 | 4.34 | 35.08 fps/W |
| Galaxy S9+ (Snapdragon 845) | 10LPP | 150.40 | 4.42 | 34.00 fps/W |
| Galaxy 10+ (Exynos 9820) | 8LPP | 166.00 | 4.96 | 33.40fps/W |
| Galaxy S9 (Exynos 9810) | 10LPP | 141.91 | 4.34 | 32.67 fps/W |
| Galaxy S8 (Snapdragon 835) | 10LPE | 108.20 | 3.45 | 31.31 fps/W |
| Mate 20 Pro (Kirin 980) | N7 | 135.75 | 4.64 | 29.25 fps/W |
| Galaxy S8 (Exynos 8895) | 10LPE | 121.00 | 5.86 | 20.65 fps/W |
Lastly, the T-Rex benchmark which is the least compute heavy workload tested here, and mostly is bottlenecked by texture and fillrate throughput, sees a 23% increase for the Snapdragon 865.
Overall GPU Conclusion – Good Improvements – Competitively Not Enough
Overall, we were able to verify the Snapdragon 865’s performance improvements and Qualcomm’s 25% claims seem to be largely accurate. The issue is that this doesn’t seem to be enough to keep up with the large improvements that Apple has been able to showcase over the last two generations.
During the chipset’s launch, Qualcomm was eager to mention that their product is able to showcase better long-term sustained performance than a competitor which “throttles within minutes”. While we don’t have confirmation as to whom exactly they were referring to, the data and narrative here only matches Apple’s device behaviour. Whilst we weren’t able to test the sustained performance of the QRD865 today, it unfortunately doesn’t really matter for Qualcomm as the Snapdragon 865 and Adreno 650’s peak performance falls in at a lower level than Apple’s A13 sustained performance.
Apple isn’t the only one Qualcomm has to worry about; the 25% performance increases this generation are within reach of Arm’s Mali-G77. In theory, Samsung’s Exynos 990 should be able to catch up with the Snapdragon 865. Qualcomm had been regarded as the mobile GPU leader over the last few years, but it’s clear that development has slowed down quite a lot recently, and the Adreno family has lost its crown.


178 Comments
View All Comments
s.yu - Tuesday, December 17, 2019 - link
There are countless shallow and useless arguments to be made from your standpoint, for example you could argue that turning system animations off "slows down" "real world experience", because without the animations filling in for the latency, "the average joe and jane" perceive "real world" lags/stutters which in reality take less time than playing the animation takes, i.e. is faster, not to mention a decrease to the load on the GPU.Sam6536 - Monday, December 16, 2019 - link
Where are rog phone 2 benchmarks?Not taking the most powerful android phone into consideration in this test isn't fair
joms_us - Tuesday, December 17, 2019 - link
How the hell Apple A9 is faster than Ryzen or Skylake if A13 is pathetically slower in this comparison and not even close to double performance as show in SPEC.https://cdn57.androidauthority.net/wp-content/uplo...
Makes me think if somebody is drinking Koolaid here?
diehardmacfan - Tuesday, December 17, 2019 - link
ahhh yes, poo-poo an industry standard benchmark like SPEC for SoC bencharking in an article about an SoC, then link to a device performance test developed by AndroidAuthority.Andrei your patience with idiots is astounding.
Nicon0s - Tuesday, December 17, 2019 - link
@diehardmacfan What exactly is wrong with Speed Test GX 2.0? And it wasn't developed by Android Authority.The SD 865 completed a bunch of real world CPU related tasks, faster than the A13. This makes this "industry standard benchmark like SPEC" quite irrelevant for somebody interesting to buying a smartphone because in actual usage the A13 doesn't present any real performance advantage.
Also in the GPU test the SD 865 was only slightly behind even if it pushed more pixels.
If I would only be interested in buying a smartphone in order to use it to run SPEC and GFXBench Aztec Ruins off-screen benchmark all day long than the iphone 11 would be my number one pick.
For anything other than that I don't see any real and tangible performance advantage.
This Anandtech performance analysis seems disconnected from the real world experience of using such high end devices. Android sites do a better job analyzing the experience and significance of the performance of these mobile SOC and what it actually means for smartphone users. For example XDA has a realy nice benchmark where they test the overall fluidity of using certain smartphones. This both tests the OS optimizations and SOC performance.
joms_us - Tuesday, December 17, 2019 - link
Excellent point, I am sick and tired of this propaganda to uplift an Apple product just because it shines in one or two primitive and bias benchmarking tool when thousands of other apps say otherwise.s.yu - Tuesday, December 17, 2019 - link
May I interest you in some rhino horn powder claimed by thousands of traditional Chinese witch...I mean doctors to enlarge your penis?s.yu - Tuesday, December 17, 2019 - link
In short: Poor validity and poor reliability. There's nothing particularly useful about that test.It generates mixed, or rather obfuscated scores correlating to an unknown extent to UI design choice, certain drivers, and hardware performance.
This is somewhat metaphysics, and has no place in science.
cha0z_ - Friday, December 27, 2019 - link
That test is fun and great, but totally not representative of anything. Taking it serious is not serious. :)MetaCube - Tuesday, December 17, 2019 - link
How are you still not banned ?