The AMD Ryzen Threadripper 3960X and 3970X Review: 24 and 32 Cores on 7nm
by Dr. Ian Cutress, Andrei Frumusanu & Gavin Bonshor on November 25, 2019 9:05 AM ESTCPU Performance: System Tests
Our System Test section focuses significantly on real-world testing, user experience, with a slight nod to throughput. In this section we cover application loading time, image processing, simple scientific physics, emulation, neural simulation, optimized compute, and 3D model development, with a combination of readily available and custom software. For some of these tests, the bigger suites such as PCMark do cover them (we publish those values in our office section), although multiple perspectives is always beneficial. In all our tests we will explain in-depth what is being tested, and how we are testing.
All of our benchmark results can also be found in our benchmark engine, Bench.
Application Load: GIMP 2.10.4
One of the most important aspects about user experience and workflow is how fast does a system respond. A good test of this is to see how long it takes for an application to load. Most applications these days, when on an SSD, load fairly instantly, however some office tools require asset pre-loading before being available. Most operating systems employ caching as well, so when certain software is loaded repeatedly (web browser, office tools), then can be initialized much quicker.
In our last suite, we tested how long it took to load a large PDF in Adobe Acrobat. Unfortunately this test was a nightmare to program for, and didn’t transfer over to Win10 RS3 easily. In the meantime we discovered an application that can automate this test, and we put it up against GIMP, a popular free open-source online photo editing tool, and the major alternative to Adobe Photoshop. We set it to load a large 50MB design template, and perform the load 10 times with 10 seconds in-between each. Due to caching, the first 3-5 results are often slower than the rest, and time to cache can be inconsistent, we take the average of the last five results to show CPU processing on cached loading.
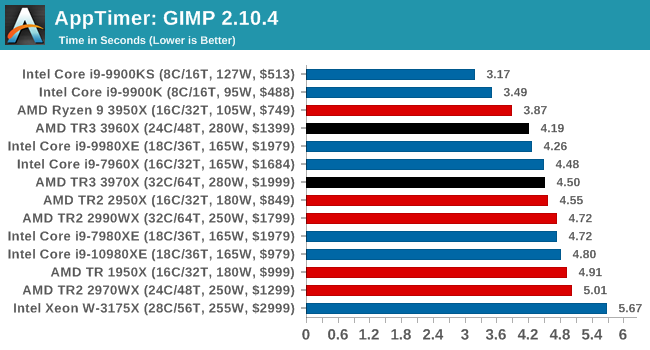
Onto our single threaded tests, and the mainstream hardware with high single thread frequencies wins here, but the 3960X is leading the rest of the pack. Intel's 28-core part here sits last, behind even the 1950X.
3D Particle Movement v2.1: Brownian Motion
Our 3DPM test is a custom built benchmark designed to simulate six different particle movement algorithms of points in a 3D space. The algorithms were developed as part of my PhD., and while ultimately perform best on a GPU, provide a good idea on how instruction streams are interpreted by different microarchitectures.
A key part of the algorithms is the random number generation – we use relatively fast generation which ends up implementing dependency chains in the code. The upgrade over the naïve first version of this code solved for false sharing in the caches, a major bottleneck. We are also looking at AVX2 and AVX512 versions of this benchmark for future reviews.
For this test, we run a stock particle set over the six algorithms for 20 seconds apiece, with 10 second pauses, and report the total rate of particle movement, in millions of operations (movements) per second. We have a non-AVX version and an AVX version, with the latter implementing AVX512 and AVX2 where possible.
3DPM v2.1 can be downloaded from our server: 3DPMv2.1.rar (13.0 MB)
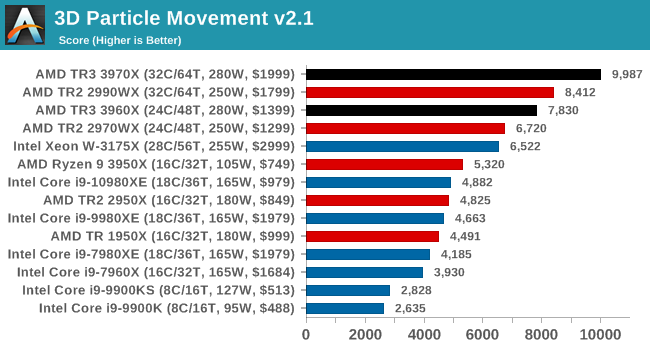
With non-AVX, AMD's floating point units put on a great performance.
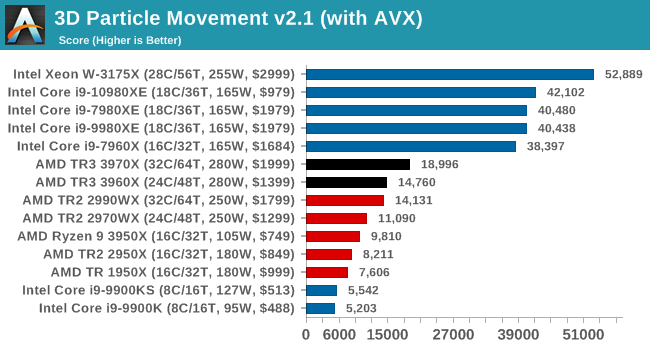
This is a workload that can be AVX512 accelerated, and this is the main instance where we can see Intel's CPUs having an advantage.
Dolphin 5.0: Console Emulation
One of the popular requested tests in our suite is to do with console emulation. Being able to pick up a game from an older system and run it as expected depends on the overhead of the emulator: it takes a significantly more powerful x86 system to be able to accurately emulate an older non-x86 console, especially if code for that console was made to abuse certain physical bugs in the hardware.
For our test, we use the popular Dolphin emulation software, and run a compute project through it to determine how close to a standard console system our processors can emulate. In this test, a Nintendo Wii would take around 1050 seconds.
The latest version of Dolphin can be downloaded from https://dolphin-emu.org/
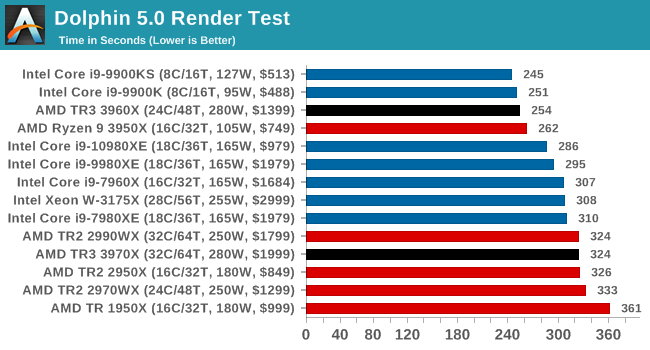
On the single threaded workloads again, and the high frequency mainstream CPUs win here. Interestingly, the 3960X also puts on a really good show, and actually beats our 3950X. Interesting.
DigiCortex 1.20: Sea Slug Brain Simulation
This benchmark was originally designed for simulation and visualization of neuron and synapse activity, as is commonly found in the brain. The software comes with a variety of benchmark modes, and we take the small benchmark which runs a 32k neuron / 1.8B synapse simulation, equivalent to a Sea Slug.

Example of a 2.1B neuron simulation
We report the results as the ability to simulate the data as a fraction of real-time, so anything above a ‘one’ is suitable for real-time work. Out of the two modes, a ‘non-firing’ mode which is DRAM heavy and a ‘firing’ mode which has CPU work, we choose the latter. Despite this, the benchmark is still affected by DRAM speed a fair amount.
DigiCortex can be downloaded from http://www.digicortex.net/
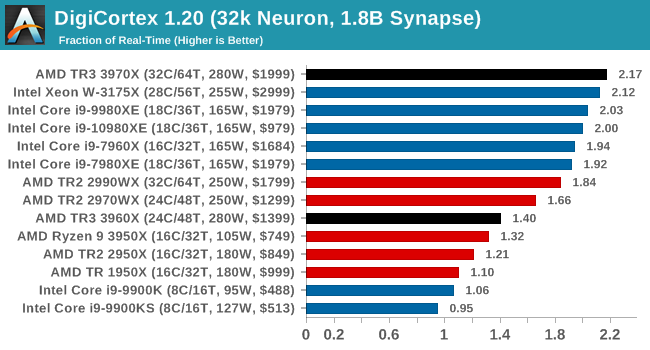
I'm surprised there's that much difference between the 3970X and 3960X here, especially with the 3960X sitting behind the TR2 processors. Might have to re-run this one to double check. But the 3970X puts out a commanding lead.
y-Cruncher v0.7.6: Microarchitecture Optimized Compute
I’ve known about y-Cruncher for a while, as a tool to help compute various mathematical constants, but it wasn’t until I began talking with its developer, Alex Yee, a researcher from NWU and now software optimization developer, that I realized that he has optimized the software like crazy to get the best performance. Naturally, any simulation that can take 20+ days can benefit from a 1% performance increase! Alex started y-cruncher as a high-school project, but it is now at a state where Alex is keeping it up to date to take advantage of the latest instruction sets before they are even made available in hardware.
For our test we run y-cruncher v0.7.6 through all the different optimized variants of the binary, single threaded and multi-threaded, including the AVX-512 optimized binaries. The test is to calculate 250m digits of Pi, and we use the single threaded and multi-threaded versions of this test.
Users can download y-cruncher from Alex’s website: http://www.numberworld.org/y-cruncher/
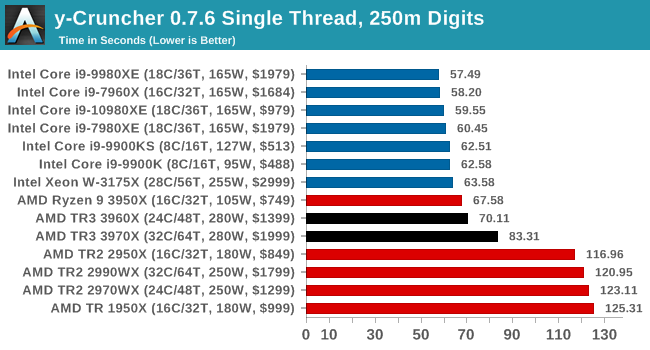
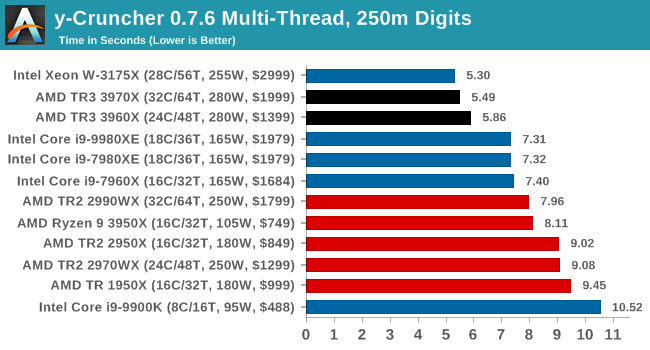
y-Cruncher is also AVX-512 accelerated, however when all the 32 threads come together in MT mode on AVX2, having that many pushes through 18 cores with AVX-512.
Agisoft Photoscan 1.3.3: 2D Image to 3D Model Conversion
One of the ISVs that we have worked with for a number of years is Agisoft, who develop software called PhotoScan that transforms a number of 2D images into a 3D model. This is an important tool in model development and archiving, and relies on a number of single threaded and multi-threaded algorithms to go from one side of the computation to the other.
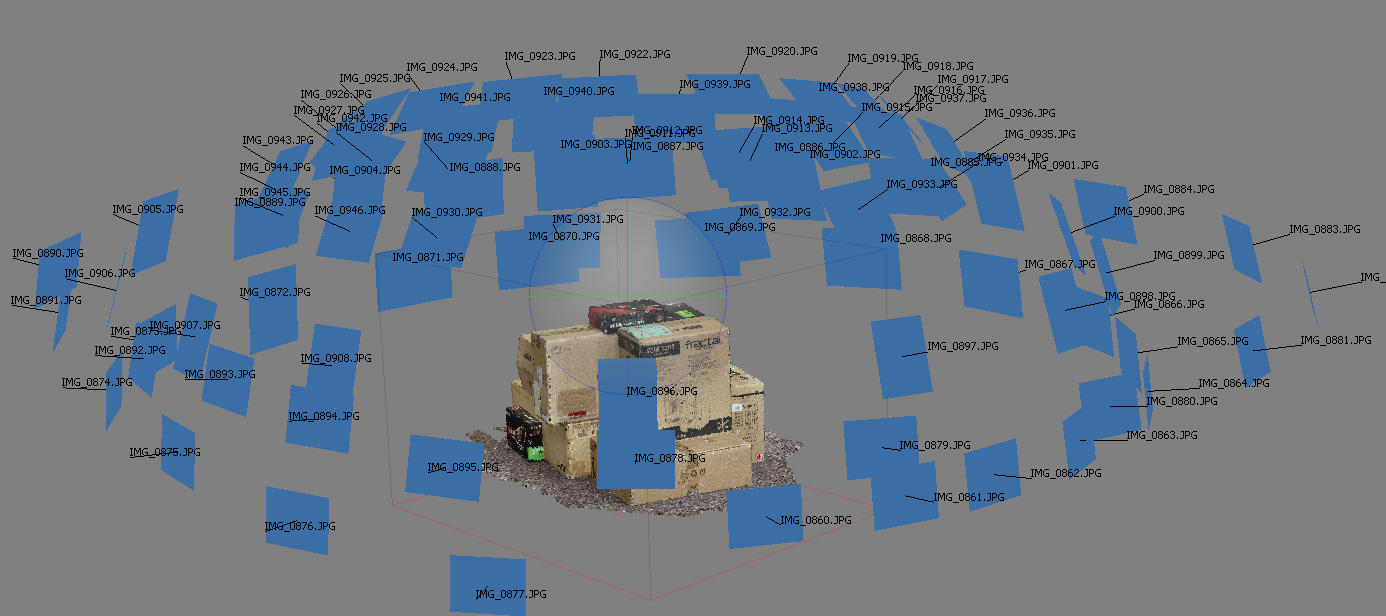
In our test, we take v1.3.3 of the software with a good sized data set of 84 x 18 megapixel photos and push it through a reasonably fast variant of the algorithms, but is still more stringent than our 2017 test. We report the total time to complete the process.
Agisoft’s Photoscan website can be found here: http://www.agisoft.com/
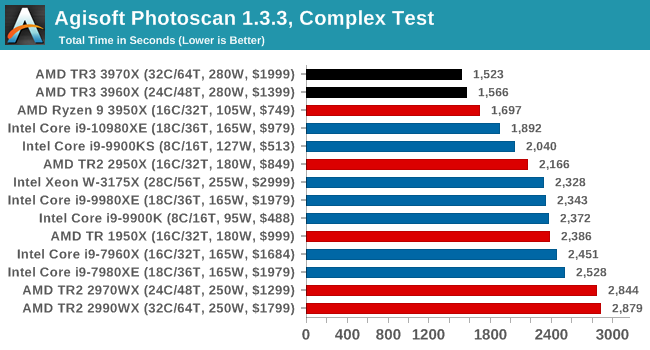
New records for Photoscan as well.


245 Comments
View All Comments
RSAUser - Tuesday, November 26, 2019 - link
I've only seen the Mozilla benchmarks on LTT, very strange that they're the only ones showing such a workload. I'd be very interested on how these chips handle e.g. large SQL Server DB's and requests, especially with those huge caches.The Mozilla benchmark had near 2x the performance for the 3970X vs the 10980X and serve the home has the ryzen chip at near 30 compiles an hour for the Linux Kernel vs around 16 for Intel.
I'd actually be really interested in the financial market for this TR due to the floating point performance increase. We'll probably be upgrading our servers next year based on current projections, so this has been a really nice development.
Dolda2000 - Monday, November 25, 2019 - link
Why is it that Intel gains so incredibly much more from AVX512 than AMD gains from AVX2?In the 3DPM2 test, the AMD CPUs gain roughly a factor of two in performance, which is exactly what I'd expect given that AVX2 is twice as wide as standard SSE. The Intel CPUs, on the other hand, gain almost a factor of 9, which is more than twice what I'd expect given that AVX512 as four times as wide as SSE.
What causes this? Does AVX512 have some other kind of tricks up its sleeves? Does opmasking benefit 3DPM2?
AnGe85 - Monday, November 25, 2019 - link
The Intel parts are derived from Xeon dies (LCC 10 cores, and HCC up to 18 cores). As such they have two AVX-512-FMA-Units.Zen/+ shows a +70 % increase in performance, Zen2 and the 9900K(S) about +90 % with AVX2 in 3DPM2.1 and the Xeon-based parts reach up to +700 %. Ian has obviously done a good job or at least used a good lib ;-)
Dolda2000 - Monday, November 25, 2019 - link
But Zen 1/2 also has two 256-bit FMAs per core. And Intel also has two SSE units per core as well, so I don't see how that would explain the ratios.yeeeeman - Monday, November 25, 2019 - link
Intel has 512bit unitsDolda2000 - Monday, November 25, 2019 - link
Exactly, which should make it 2× as fast, not 4.5×.abufrejoval - Tuesday, November 26, 2019 - link
The other element of magic is typically halved operand size=twice the data element throughput.Could be FP16 vs FP32 in that code, which means 32 vector elements per 512 bit register and then again of these registers there could be mulitples under SIMD per instruction and clock.
Xyler94 - Tuesday, November 26, 2019 - link
Servethehome also mentioned in their reviews of Epyc Rome Processors, the same basic Zen2 platform that the new TR CPUs are made on, that most programs aren't optimized for AMD's new AVX2 pipes, so the results are lower than they should be. I don't know if that's still the case, but it may be a reason why it's showing such a disparity between the two.Slash3 - Monday, November 25, 2019 - link
Wow.Just wow.
shaolin95 - Monday, November 25, 2019 - link
Why wont yuo enable IGPU for the 9900k on the Premiere test? It will change the performance dramatically.