The Intel Core i9-9900KS Review: The 5 GHz Consumer Special
by Dr. Ian Cutress on October 31, 2019 10:45 AM ESTCPU Performance: System Tests
Our System Test section focuses significantly on real-world testing, user experience, with a slight nod to throughput. In this section we cover application loading time, image processing, simple scientific physics, emulation, neural simulation, optimized compute, and 3D model development, with a combination of readily available and custom software. For some of these tests, the bigger suites such as PCMark do cover them (we publish those values in our office section), although multiple perspectives is always beneficial. In all our tests we will explain in-depth what is being tested, and how we are testing.
All of our benchmark results can also be found in our benchmark engine, Bench.
Application Load: GIMP 2.10.4
One of the most important aspects about user experience and workflow is how fast does a system respond. A good test of this is to see how long it takes for an application to load. Most applications these days, when on an SSD, load fairly instantly, however some office tools require asset pre-loading before being available. Most operating systems employ caching as well, so when certain software is loaded repeatedly (web browser, office tools), then can be initialized much quicker.
In our last suite, we tested how long it took to load a large PDF in Adobe Acrobat. Unfortunately this test was a nightmare to program for, and didn’t transfer over to Win10 RS3 easily. In the meantime we discovered an application that can automate this test, and we put it up against GIMP, a popular free open-source online photo editing tool, and the major alternative to Adobe Photoshop. We set it to load a large 50MB design template, and perform the load 10 times with 10 seconds in-between each. Due to caching, the first 3-5 results are often slower than the rest, and time to cache can be inconsistent, we take the average of the last five results to show CPU processing on cached loading.
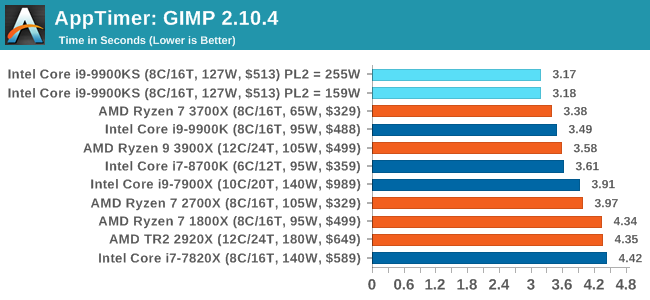
The 9900KS hits the top of all the consumer processors in our app loading test.
FCAT: Image Processing
The FCAT software was developed to help detect microstuttering, dropped frames, and run frames in graphics benchmarks when two accelerators were paired together to render a scene. Due to game engines and graphics drivers, not all GPU combinations performed ideally, which led to this software fixing colors to each rendered frame and dynamic raw recording of the data using a video capture device.
The FCAT software takes that recorded video, which in our case is 90 seconds of a 1440p run of Rise of the Tomb Raider, and processes that color data into frame time data so the system can plot an ‘observed’ frame rate, and correlate that to the power consumption of the accelerators. This test, by virtue of how quickly it was put together, is single threaded. We run the process and report the time to completion.
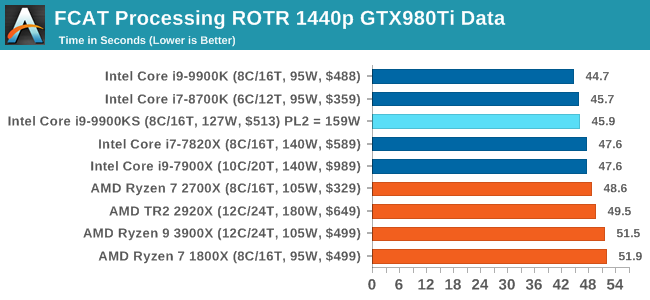
For some reason our default 9900KS run didn't seem to perform properly, but the 9900KS at Intel guidelines did, within the margin of error of the 9900K which also does turbo at 5.0 GHz.
3D Particle Movement v2.1: Brownian Motion
Our 3DPM test is a custom built benchmark designed to simulate six different particle movement algorithms of points in a 3D space. The algorithms were developed as part of my PhD., and while ultimately perform best on a GPU, provide a good idea on how instruction streams are interpreted by different microarchitectures.
A key part of the algorithms is the random number generation – we use relatively fast generation which ends up implementing dependency chains in the code. The upgrade over the naïve first version of this code solved for false sharing in the caches, a major bottleneck. We are also looking at AVX2 and AVX512 versions of this benchmark for future reviews.
For this test, we run a stock particle set over the six algorithms for 20 seconds apiece, with 10 second pauses, and report the total rate of particle movement, in millions of operations (movements) per second. We have a non-AVX version and an AVX version, with the latter implementing AVX512 and AVX2 where possible.
3DPM v2.1 can be downloaded from our server: 3DPMv2.1.rar (13.0 MB)
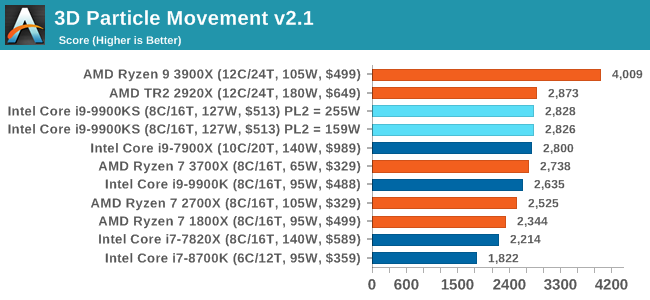
Without AVX acceleration, the Core i9-9900KS hardware manages to push ahead of the 9900K due to the extra frequency, and even above the 10-core 7900X. Because these are non-AVX instructions, they aren't pushing the CPU as hard as it can be, so we're not really draining the turbo bucket in our 159W PL2 test.
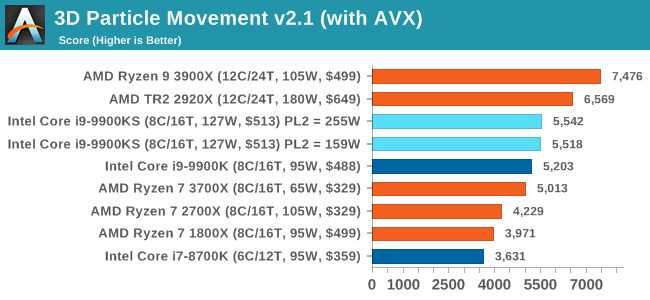
On the other hand, our AVX2 accelerated test is also showing both PL2 settings performing about equal. This test does involve a 10-second delay between each of its six subtests, which allows some turbo budget to be regained. Couple that with the 30 second delay between individual runs, it would appear that there's enough turbo budget for the whole run.
Dolphin 5.0: Console Emulation
One of the popular requested tests in our suite is to do with console emulation. Being able to pick up a game from an older system and run it as expected depends on the overhead of the emulator: it takes a significantly more powerful x86 system to be able to accurately emulate an older non-x86 console, especially if code for that console was made to abuse certain physical bugs in the hardware.
For our test, we use the popular Dolphin emulation software, and run a compute project through it to determine how close to a standard console system our processors can emulate. In this test, a Nintendo Wii would take around 1050 seconds.
The latest version of Dolphin can be downloaded from https://dolphin-emu.org/
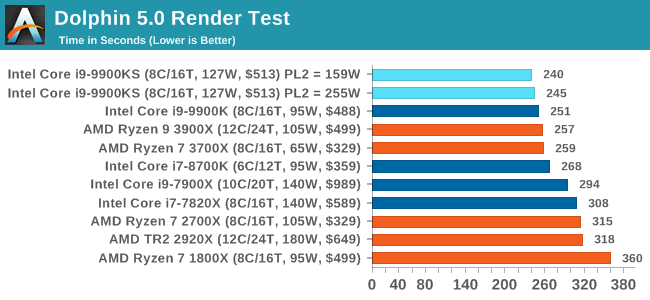
Dolphin loves single threaded performance, so we see the 9900 series at the top here.
DigiCortex 1.20: Sea Slug Brain Simulation
This benchmark was originally designed for simulation and visualization of neuron and synapse activity, as is commonly found in the brain. The software comes with a variety of benchmark modes, and we take the small benchmark which runs a 32k neuron / 1.8B synapse simulation, equivalent to a Sea Slug.
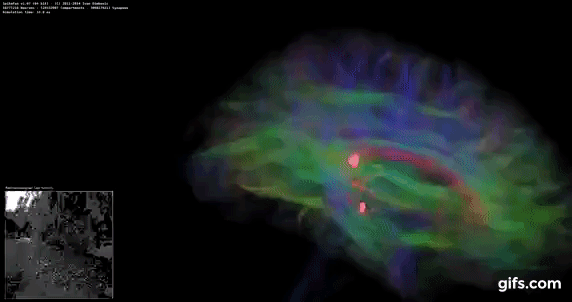
Example of a 2.1B neuron simulation
We report the results as the ability to simulate the data as a fraction of real-time, so anything above a ‘one’ is suitable for real-time work. Out of the two modes, a ‘non-firing’ mode which is DRAM heavy and a ‘firing’ mode which has CPU work, we choose the latter. Despite this, the benchmark is still affected by DRAM speed a fair amount.
DigiCortex can be downloaded from http://www.digicortex.net/
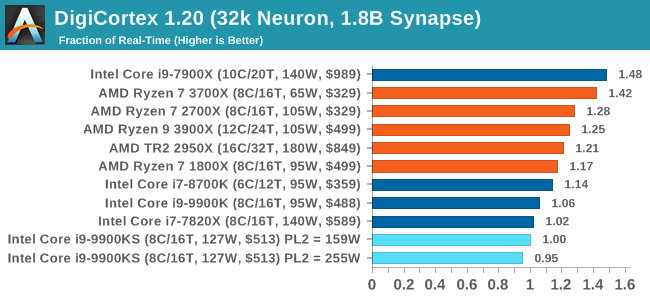
Interestingly enough the big splot in this benchmark series is here with DigiCortex. I'm not sure what's going on here; not only with the result being low (due to DDR4-2666 compared to AMD's higher support) but also lower than the 9900K.
y-Cruncher v0.7.6: Microarchitecture Optimized Compute
I’ve known about y-Cruncher for a while, as a tool to help compute various mathematical constants, but it wasn’t until I began talking with its developer, Alex Yee, a researcher from NWU and now software optimization developer, that I realized that he has optimized the software like crazy to get the best performance. Naturally, any simulation that can take 20+ days can benefit from a 1% performance increase! Alex started y-cruncher as a high-school project, but it is now at a state where Alex is keeping it up to date to take advantage of the latest instruction sets before they are even made available in hardware.
For our test we run y-cruncher v0.7.6 through all the different optimized variants of the binary, single threaded and multi-threaded, including the AVX-512 optimized binaries. The test is to calculate 250m digits of Pi, and we use the single threaded and multi-threaded versions of this test.
Users can download y-cruncher from Alex’s website: http://www.numberworld.org/y-cruncher/
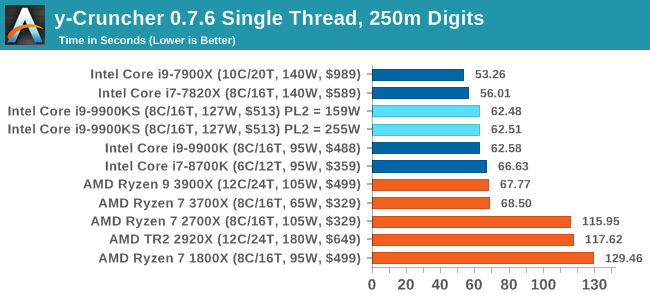
y-Cruncher can use AVX512 for the HEDT chips, as they are faster than the 9900KS, but all the 9900 series are performing similarly at 5.0 GHz single threaded here.
Agisoft Photoscan 1.3.3: 2D Image to 3D Model Conversion
One of the ISVs that we have worked with for a number of years is Agisoft, who develop software called PhotoScan that transforms a number of 2D images into a 3D model. This is an important tool in model development and archiving, and relies on a number of single threaded and multi-threaded algorithms to go from one side of the computation to the other.
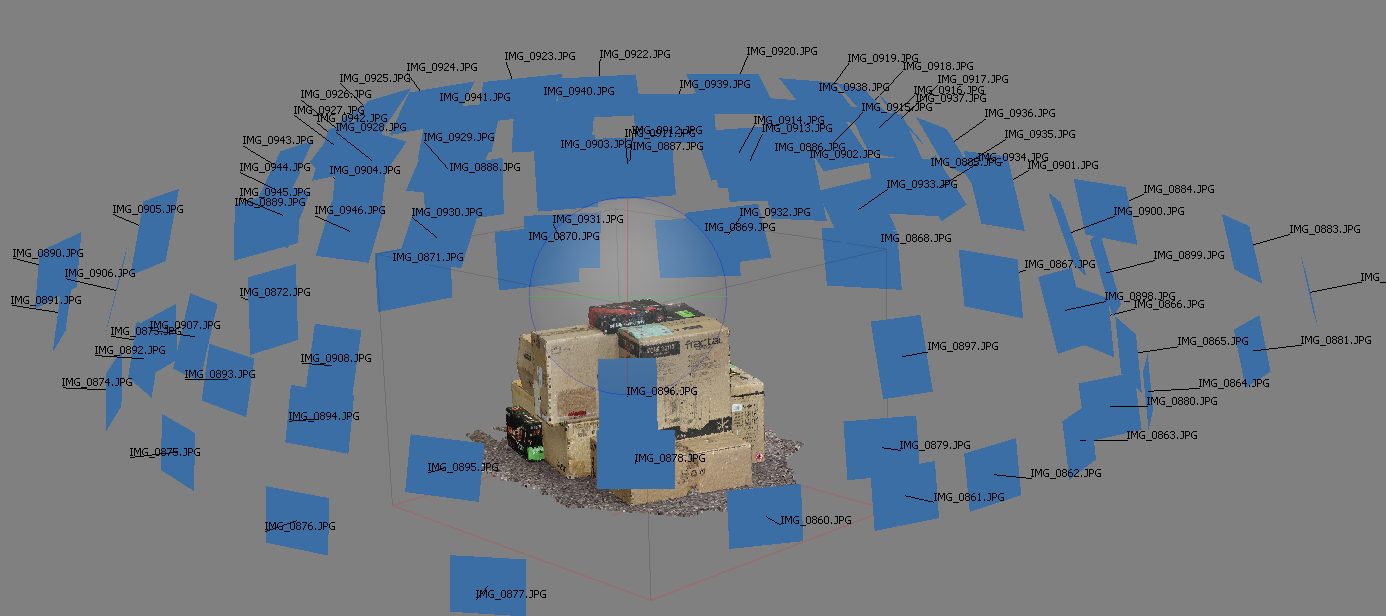
In our test, we take v1.3.3 of the software with a good sized data set of 84 x 18 megapixel photos and push it through a reasonably fast variant of the algorithms, but is still more stringent than our 2017 test. We report the total time to complete the process.
Agisoft’s Photoscan website can be found here: http://www.agisoft.com/
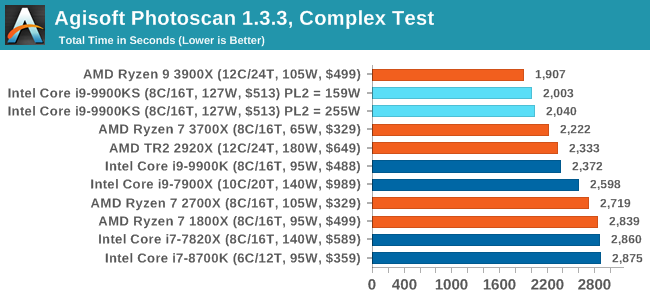
Agisoft is a more variable workload, so there will be bits here and there where both processors can fully go to 5.0 GHz turbo and recover budget. The 12-core AMD chip is ahead, and both 9900KS settings are almost equal. They are both ahead of the normal 9900K by just over 10%.


235 Comments
View All Comments
1_rick - Thursday, October 31, 2019 - link
As far as pricing goes, Microcenter lists it as in stock for $599 (might be an in-store only price). Newegg lists it for $569, but they're sold out.Sahrin - Thursday, October 31, 2019 - link
lol, this is supposed to be the chip Intel launches in response to AMD's second-best to get the 'last word' - instead it's a replay of Zen2 launch day all over again with the 9900K's sporty younger brother getting humiliated.ballsystemlord - Thursday, October 31, 2019 - link
Spelling and grammar errors:"...but the system was fully table the entire time."
"stable" not "table".
"...but the system was fully stable the entire time."
"It would appear that there is something else the bottleneck in this test."
Mis-written:
"It would appear that there is some other bottleneck in this test."
ballsystemlord - Thursday, October 31, 2019 - link
"One question that does remain however, is which set of results should we keep?" Keep to Intel guidelines. That's what you do with memory speeds and other things, I'm sure.That is also the guaranteed results for all consumers.
Goloith - Thursday, October 31, 2019 - link
Normally this hardware site is my "go to" for hardware reviews. However, holy mother of Jebus was this test bed terrible. Let's buy a Porshe and throw on old outdated tires on it. This should have been paired with a 2080 to, but you pair it with a 1080?Rule# 1, don't go full retard.
Goloith - Thursday, October 31, 2019 - link
Or with a 2080 tiDeath666Angel - Saturday, November 2, 2019 - link
The thing is, that would invalidate all older results. I'm guessing they will update the GPU in 2020 and retest certain legacy CPUs. What do you think would fundamentally change about the results with a newer GPU, though? I doubt it would be much, since the trends are the same with all the different graphical settings they already test at.ablevemona - Friday, November 1, 2019 - link
"in its hexagonal box"?Nichronos - Friday, November 1, 2019 - link
Why there isn't any Voltage table as all other Anandtech review have? We want to know how much can you undervolt the KS at the stock 5GHz!!!Thunder 57 - Friday, November 1, 2019 - link
Is that Katamari all over your new toys again??