The Crucial P1 1TB SSD Review: The Other Consumer QLC SSD
by Billy Tallis on November 8, 2018 9:00 AM ESTRandom Read Performance
Our first test of random read performance uses very short bursts of operations issued one at a time with no queuing. The drives are given enough idle time between bursts to yield an overall duty cycle of 20%, so thermal throttling is impossible. Each burst consists of a total of 32MB of 4kB random reads, from a 16GB span of the disk. The total data read is 1GB.
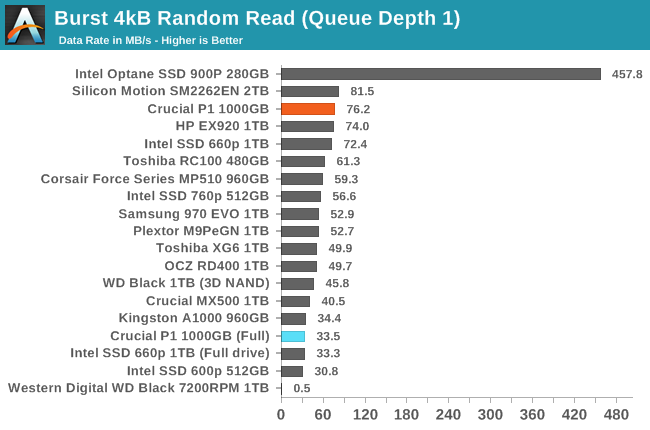
When the Crucial P1 has plenty of unused capacity and its SLC cache is large enough to contain the entire 16GB of test data, the burst random read performance is excellent. When the drive is full and the test data can no longer fit in the SLC cache, the performance falls behind the Crucial MX500 and most low-end NVMe SSDs.
Our sustained random read performance is similar to the random read test from our 2015 test suite: queue depths from 1 to 32 are tested, and the average performance and power efficiency across QD1, QD2 and QD4 are reported as the primary scores. Each queue depth is tested for one minute or 32GB of data transferred, whichever is shorter. After each queue depth is tested, the drive is given up to one minute to cool off so that the higher queue depths are unlikely to be affected by accumulated heat build-up. The individual read operations are again 4kB, and cover a 64GB span of the drive.
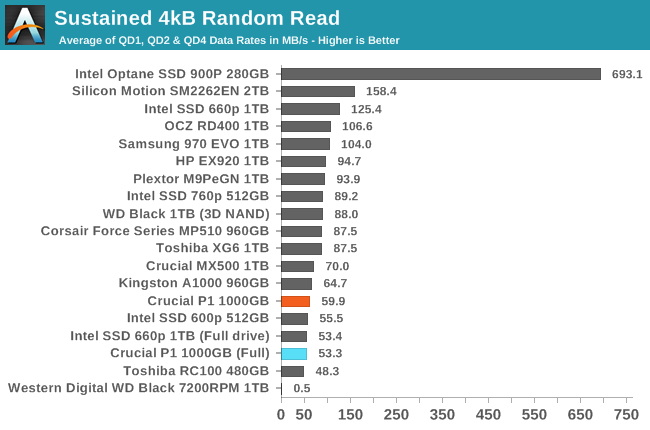
The sustained random read performance of the Crucial P1 at low queue depths is mediocre at best, falling behind most TLC-based NVMe SSDs and the Crucial MX500. By contrast, the Intel 660p manages to retain its high performance even on the sustained test, indicating that the Intel drive kept more of the test data in its SLC cache than the Crucial P1 does. When the test is run on a full drive, the P1 and the 660p have equivalent performance that is about 12% slower than the P1 with only the 64GB test data file.
 |
|||||||||
| Power Efficiency in MB/s/W | Average Power in W | ||||||||
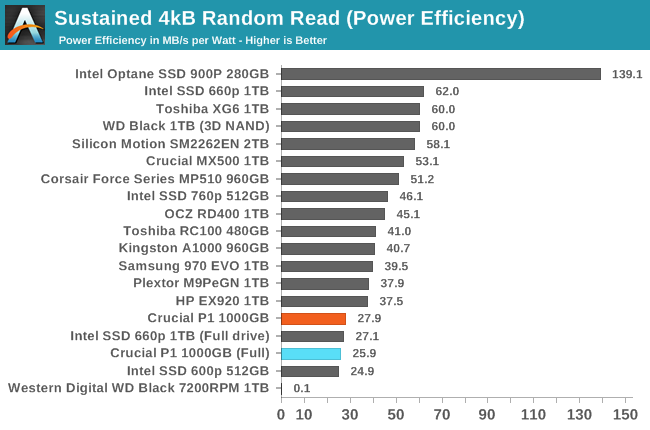
The power efficiency of the Crucial P1 during the sustained random read test is less than half of what the Intel 660p offers, due almost entirely to the large performance difference. At just over 2W, the power consumption of the P1 is reasonable, but it doesn't provide the performance to match when the test data isn't in the SLC cache.
 |
|||||||||
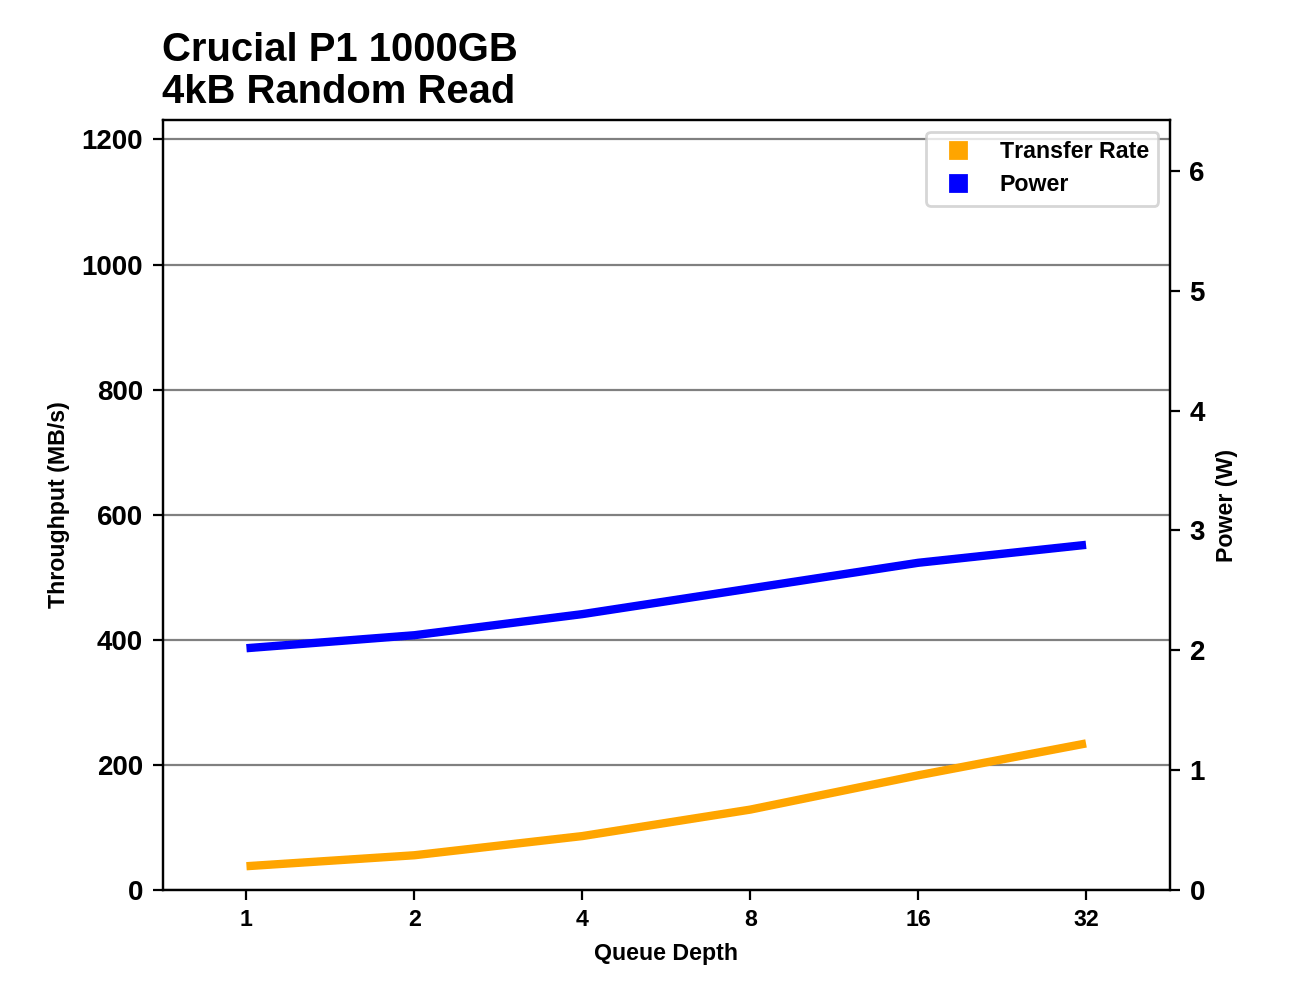
The random read performance of the Crucial P1 increases modestly with higher queue depths, but it pales in comparison to what the Intel 660p delivers by serving most of the reads for this test out of its SLC cache. Even the Crucial MX500 develops a large lead over the P1 at the highest queue depths, while using less power.
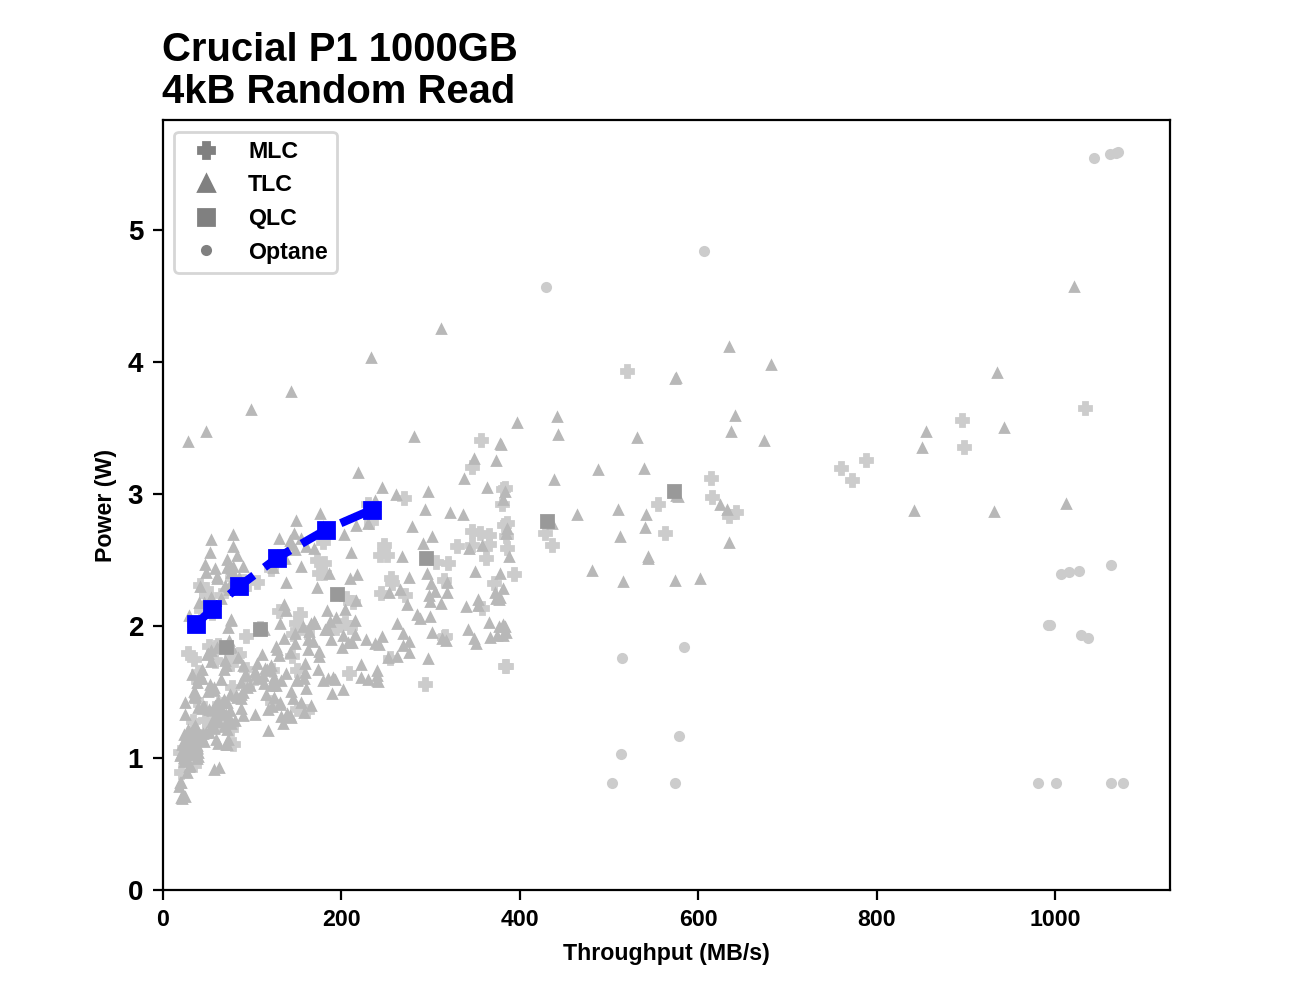
Plotting the sustained random read performance and power consumption of the Crucial P1 against the rest of the drives that have run through our 2018 SSD test suite, it is clear that the drive doesn't measure up well against even most SATA SSDs, let alone NVMe drives that go beyond the SATA speed limit when given a sufficiently high queue depth. Thanks to its SLC cache being more suited to these test conditions, the Intel 660p is among those NVMe drives that beat the limits of SATA.
Random Write Performance
Our test of random write burst performance is structured similarly to the random read burst test, but each burst is only 4MB and the total test length is 128MB. The 4kB random write operations are distributed over a 16GB span of the drive, and the operations are issued one at a time with no queuing.
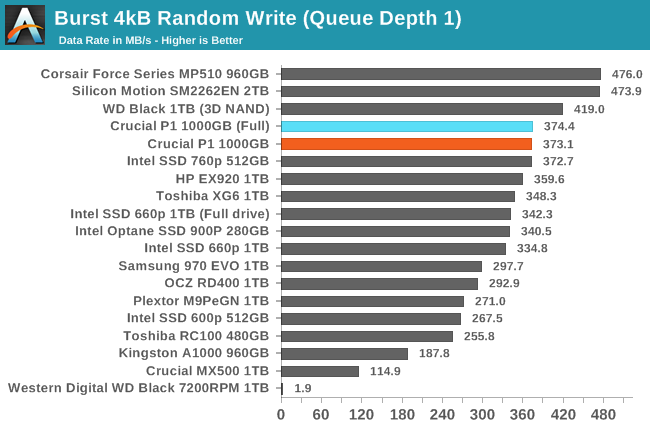
The burst random write performance of the Crucial P1 is good, but not quite on par with the top tier of NVMe SSDs. The Intel 660p is about 10% slower. Both drives clearly have enough free SLC cache to handle this test even when the drives are completely full.
As with the sustained random read test, our sustained 4kB random write test runs for up to one minute or 32GB per queue depth, covering a 64GB span of the drive and giving the drive up to 1 minute of idle time between queue depths to allow for write caches to be flushed and for the drive to cool down.
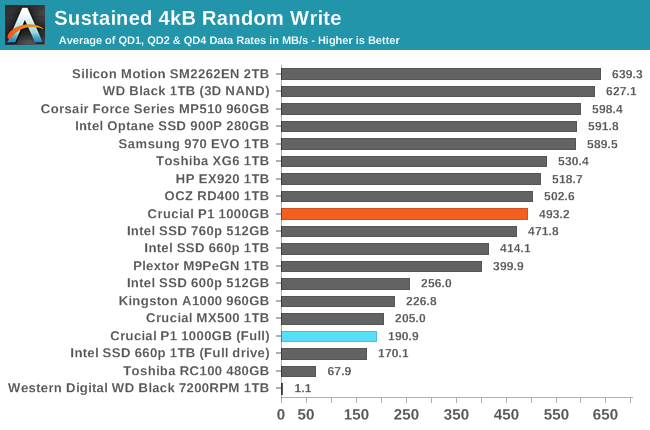
The longer sustained random write test involves enough data to show the effects of the variable SLC cache size on the Crucial P1: performance on a full drive is less than half of what the drive provides when it only contains the 64GB test data. As with the burst random write test, the P1 has a small but clear performance advantage over the Intel 660p.
 |
|||||||||
| Power Efficiency in MB/s/W | Average Power in W | ||||||||
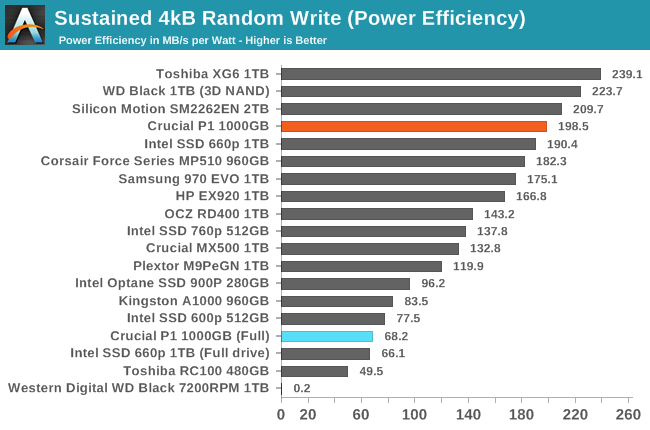
When the sustained random write test is run on the Crucial P1 containing only the test data, it delivers excellent power efficiency. When the drive is full and the SLC cache is inadequate, power consumption increases slightly and efficiency is reduced by almost a factor of three.
 |
|||||||||
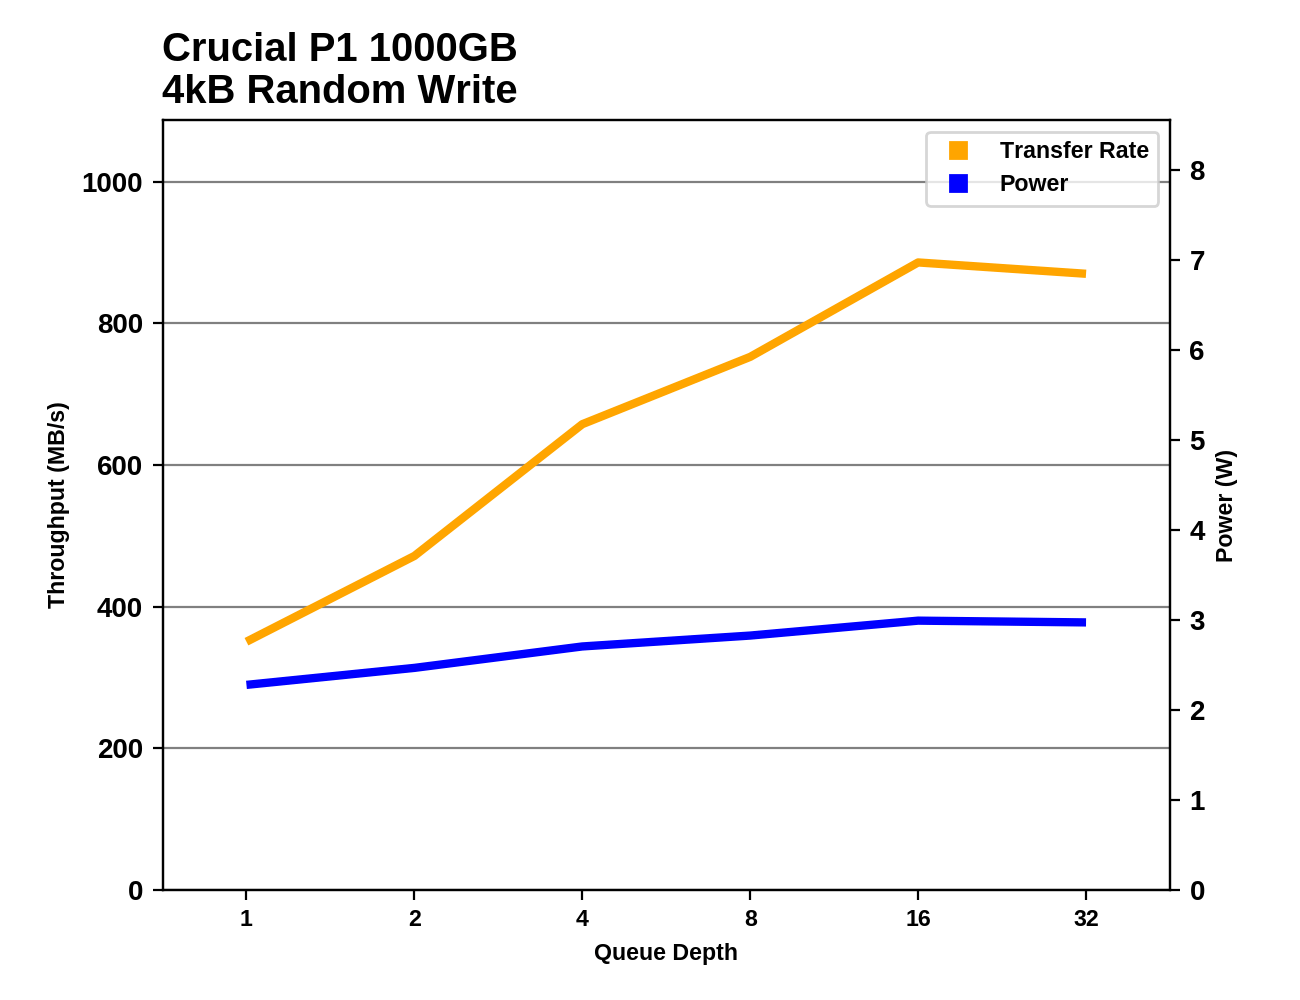
Even when the random write test is conducted on an otherwise empty Crucial P1, the SLC cache starts to fill up by the time the queue depth reaches 32. When the drive is full and the cache is at its minimum size, random write performance decreases with each phase of the test despite the increasing queue depth. By contrast, the Intel 660p shows signs of its SLC cache filling up after QD4 even when the drive is otherwise empty, but its full-drive performance is steadier.
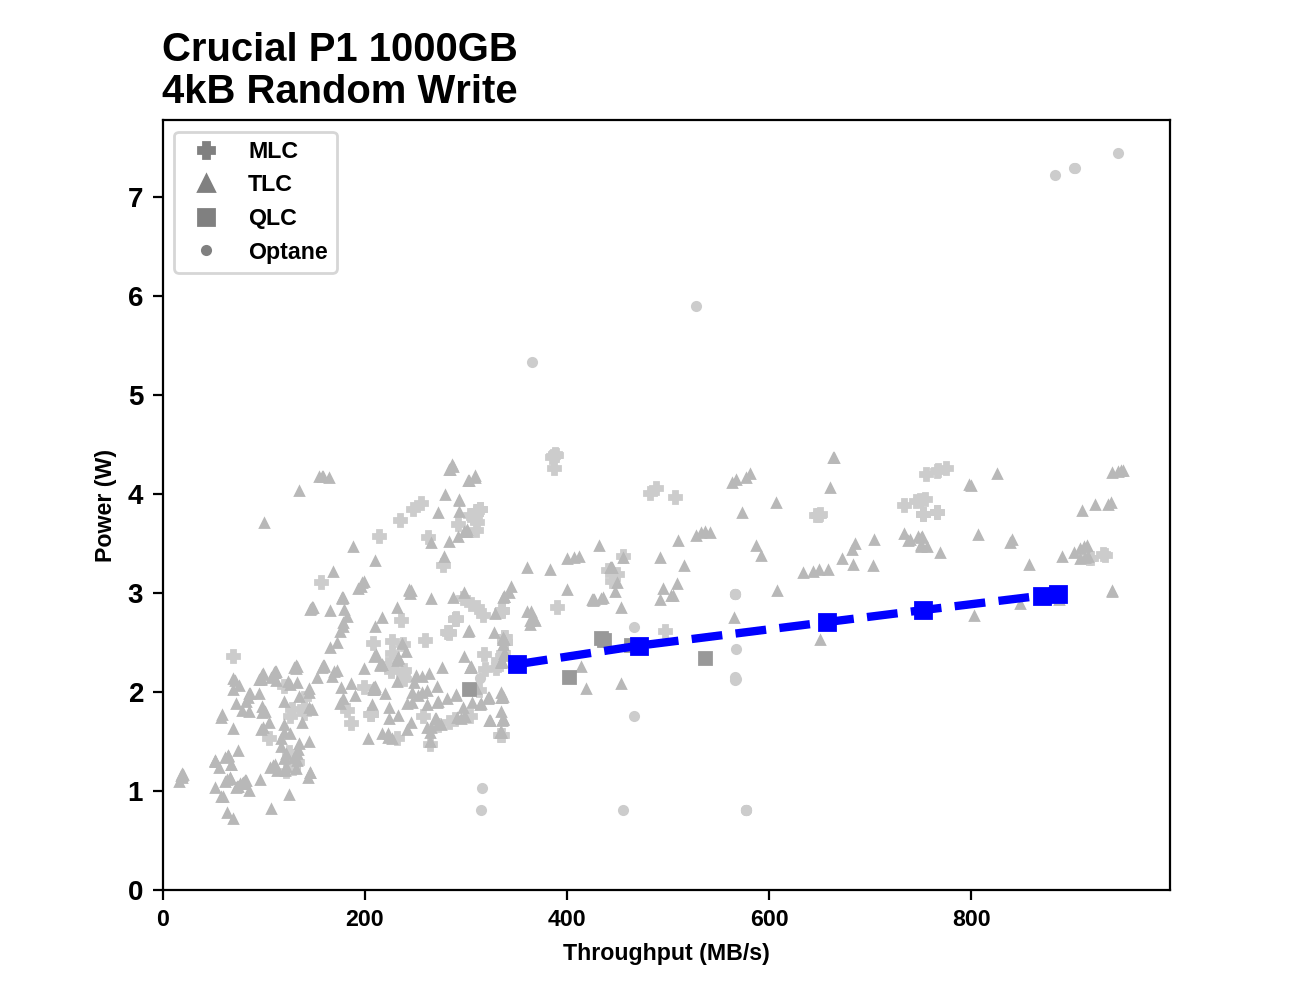
Plotting the Crucial P1's sustained random write performance and power consumption against the rest of the drives that have completed our 2018 SSD test suite emphasizes the excellent combination of performance and power efficiency enabled by the very effective SLC write cache. The P1 requires more power than many SATA drives, but almost all NVMe drives require more power to deliver the same performance, and the very fastest drives aren't much faster than the peak write speed of the Crucial P1.


66 Comments
View All Comments
Mikewind Dale - Thursday, November 8, 2018 - link
Sic:"A reduction in quantity and an increase in price will increase net revenue only if demand is elastic."
That should be "inelastic."
limitedaccess - Thursday, November 8, 2018 - link
The transition to TLC drives was also shortly followed with the transition to 3D NAND using higher process (larger) from smaller planar litho process. While smaller litho allowed more density it also came with the trade off of worse endurance/higher decay. So the transition to 3D NAND effectively offset the issues of MLC->TLC which is where we are today. What's the equivalent for TLC->QLC?Low litho planar TLC drives were the ones that were poorly received and performed worse then they reviewed in reality due to decay. And decay is the real issue here with QLC since no reviewer tests for it (it isn't the same as poor write endurance). Is that file I don't regularly access going to maintain the same read speeds or have massively higher latency to access due to the need for ECC to kick in?
0ldman79 - Monday, November 12, 2018 - link
I may not be correct on the exact numbers, but I think the NAND lithography has stopped at 22nm as they were having issues retaining data on 14nm, just no real benefit going to a smaller lithography.They may tune that in a couple of years, but the only way I can see that working with my rudimentary understanding of the system is to keep everything the same size as the 22nm (gates, gaps, fences, chains, roads, whatever, it's too late/early for me to remember the correct terms), same gaps only on a smaller process. They'd have no reduction in cost as they'd be using the same amount of each wafer, might have a reduction in power consumption.
I'm eager to see how they address the problem but it really looks like QLC may be a dead end. Eventually we're going to hit walls where lithography can't improve and we're going to have to come at the problem (cpu speed, memory speeds, NAND speeds, etc) from an entirely different angle than what we've been doing. For what, 40 years, we've been doing major design changes every 5 years or so and just relying on lithography to improve clock speeds.
I think that is about to cease entirely. They can probably go farther than what we're seeing but not economically.
Lolimaster - Friday, November 9, 2018 - link
Youre not specting a drive limited to 500MB to be as fast as a PCI-E 4x SSD with full support for it...TLC vs MLC all goes to endurance and degraded performance when the drive is full or the cache is exhausted.
Lolimaster - Friday, November 9, 2018 - link
Random performance seems the land of Optane and similar. Even the 16GB optane M10 absoluletely murders even the top of the line NVME Samsung MLC SSD.PaoDeTech - Thursday, November 8, 2018 - link
Yes, price is still too high. But it will come down. I think that the conclusions fail to highlight the main strength of this SSD: top performance / power. For portable devices, this is the key metric to consider. In this regard is far ahead any SATA SSD and almost all PCIe out there.Lolimaster - Friday, November 9, 2018 - link
Exactly. QLC should stick to big multiterabyte drives for avrg user or HEDT.Like 4TB+.
0ldman79 - Monday, November 12, 2018 - link
I think that's where they need to place QLC.Massive "read mostly" storage. xx layer TLC for a performance drive, QLC for massive data storage, ie; all of my Steam games installed on a 10 cent per gig "read mostly" drive while the OS and my general use is on a 22 cent per gig TLC.
That's what they're trying to do with that SLC cache, but I think they need to push it a lot farther, throw a 500GB TLC cache on a 4 terabyte QLC drive. That might be able to have it fit into the mainstream NVME lineup.
Flunk - Thursday, November 8, 2018 - link
MSRP seems a little high, I recently picked up an HP EX920 1TB for $255 and that's a much faster drive. Perhaps the street price will be lower.B3an - Thursday, November 8, 2018 - link
That latency is APPALLING and the performance is below par. If this was dirt cheap it might be worth it to some people, but at that price it's a joke.