The Intel 9th Gen Review: Core i9-9900K, Core i7-9700K and Core i5-9600K Tested
by Ian Cutress on October 19, 2018 9:00 AM EST- Posted in
- CPUs
- Intel
- Coffee Lake
- 14++
- Core 9th Gen
- Core-S
- i9-9900K
- i7-9700K
- i5-9600K
CPU Performance: Web and Legacy Tests
While more the focus of low-end and small form factor systems, web-based benchmarks are notoriously difficult to standardize. Modern web browsers are frequently updated, with no recourse to disable those updates, and as such there is difficulty in keeping a common platform. The fast paced nature of browser development means that version numbers (and performance) can change from week to week. Despite this, web tests are often a good measure of user experience: a lot of what most office work is today revolves around web applications, particularly email and office apps, but also interfaces and development environments. Our web tests include some of the industry standard tests, as well as a few popular but older tests.
We have also included our legacy benchmarks in this section, representing a stack of older code for popular benchmarks.
All of our benchmark results can also be found in our benchmark engine, Bench.
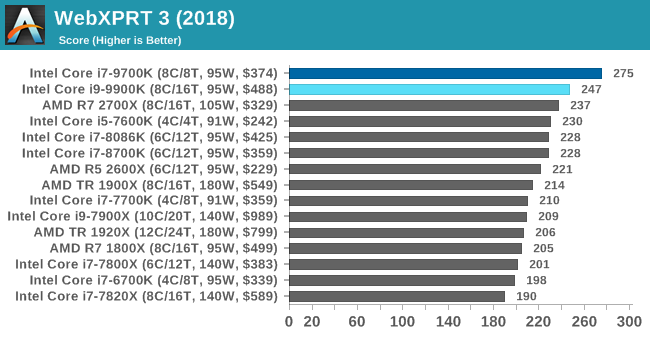
WebXPRT 3: Modern Real-World Web Tasks, including AI
The company behind the XPRT test suites, Principled Technologies, has recently released the latest web-test, and rather than attach a year to the name have just called it ‘3’. This latest test (as we started the suite) has built upon and developed the ethos of previous tests: user interaction, office compute, graph generation, list sorting, HTML5, image manipulation, and even goes as far as some AI testing.
For our benchmark, we run the standard test which goes through the benchmark list seven times and provides a final result. We run this standard test four times, and take an average.
Users can access the WebXPRT test at http://principledtechnologies.com/benchmarkxprt/webxprt/
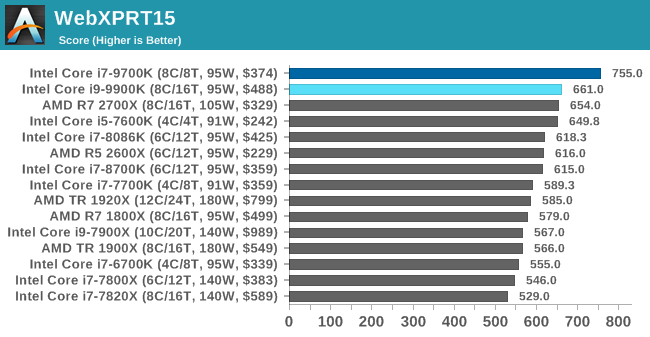
WebXPRT 2015: HTML5 and Javascript Web UX Testing
The older version of WebXPRT is the 2015 edition, which focuses on a slightly different set of web technologies and frameworks that are in use today. This is still a relevant test, especially for users interacting with not-the-latest web applications in the market, of which there are a lot. Web framework development is often very quick but with high turnover, meaning that frameworks are quickly developed, built-upon, used, and then developers move on to the next, and adjusting an application to a new framework is a difficult arduous task, especially with rapid development cycles. This leaves a lot of applications as ‘fixed-in-time’, and relevant to user experience for many years.
Similar to WebXPRT3, the main benchmark is a sectional run repeated seven times, with a final score. We repeat the whole thing four times, and average those final scores.
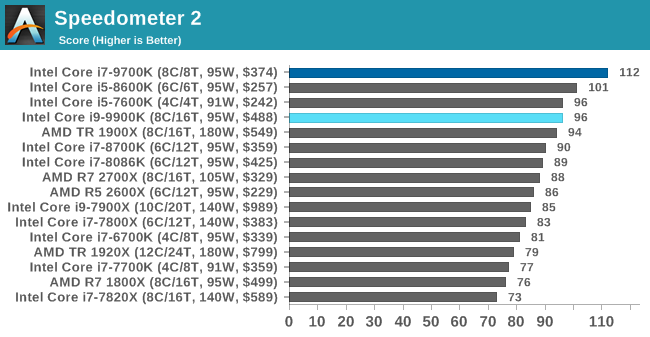
Speedometer 2: JavaScript Frameworks
Our newest web test is Speedometer 2, which is a accrued test over a series of javascript frameworks to do three simple things: built a list, enable each item in the list, and remove the list. All the frameworks implement the same visual cues, but obviously apply them from different coding angles.
Our test goes through the list of frameworks, and produces a final score indicative of ‘rpm’, one of the benchmarks internal metrics. We report this final score.
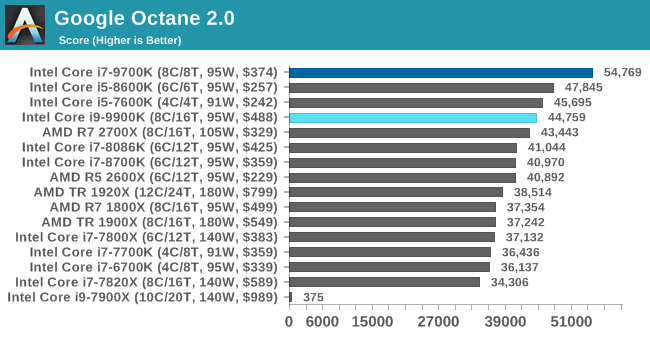
Google Octane 2.0: Core Web Compute
A popular web test for several years, but now no longer being updated, is Octane, developed by Google. Version 2.0 of the test performs the best part of two-dozen compute related tasks, such as regular expressions, cryptography, ray tracing, emulation, and Navier-Stokes physics calculations.
The test gives each sub-test a score and produces a geometric mean of the set as a final result. We run the full benchmark four times, and average the final results.
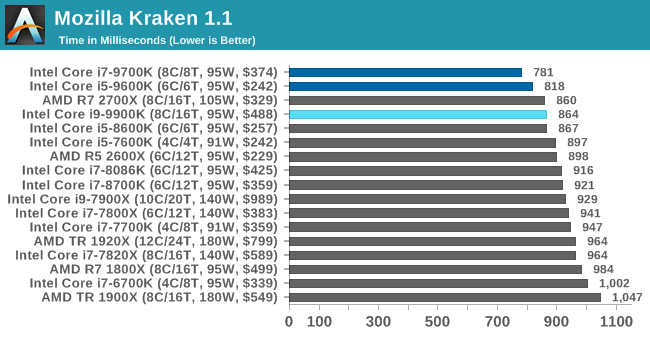
Mozilla Kraken 1.1: Core Web Compute
Even older than Octane is Kraken, this time developed by Mozilla. This is an older test that does similar computational mechanics, such as audio processing or image filtering. Kraken seems to produce a highly variable result depending on the browser version, as it is a test that is keenly optimized for.
The main benchmark runs through each of the sub-tests ten times and produces an average time to completion for each loop, given in milliseconds. We run the full benchmark four times and take an average of the time taken.
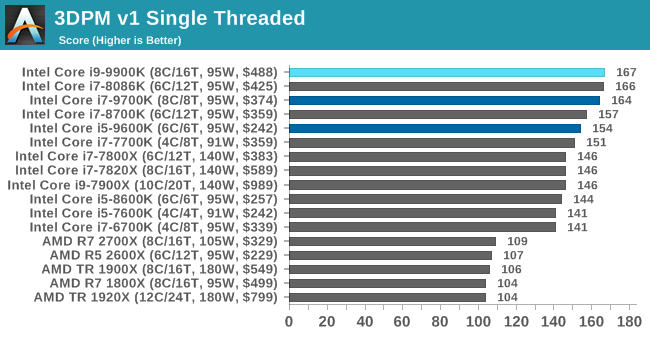
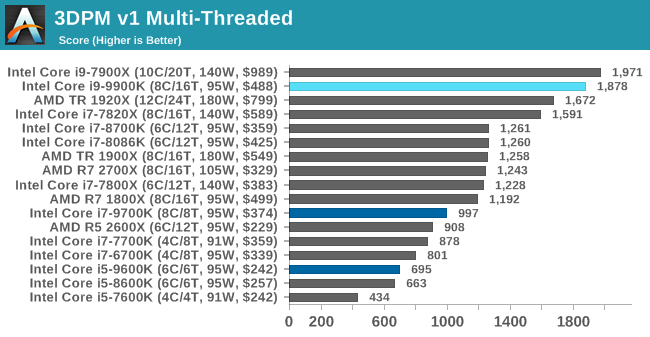
3DPM v1: Naïve Code Variant of 3DPM v2.1
The first legacy test in the suite is the first version of our 3DPM benchmark. This is the ultimate naïve version of the code, as if it was written by scientist with no knowledge of how computer hardware, compilers, or optimization works (which in fact, it was at the start). This represents a large body of scientific simulation out in the wild, where getting the answer is more important than it being fast (getting a result in 4 days is acceptable if it’s correct, rather than sending someone away for a year to learn to code and getting the result in 5 minutes).
In this version, the only real optimization was in the compiler flags (-O2, -fp:fast), compiling it in release mode, and enabling OpenMP in the main compute loops. The loops were not configured for function size, and one of the key slowdowns is false sharing in the cache. It also has long dependency chains based on the random number generation, which leads to relatively poor performance on specific compute microarchitectures.
3DPM v1 can be downloaded with our 3DPM v2 code here: 3DPMv2.1.rar (13.0 MB)
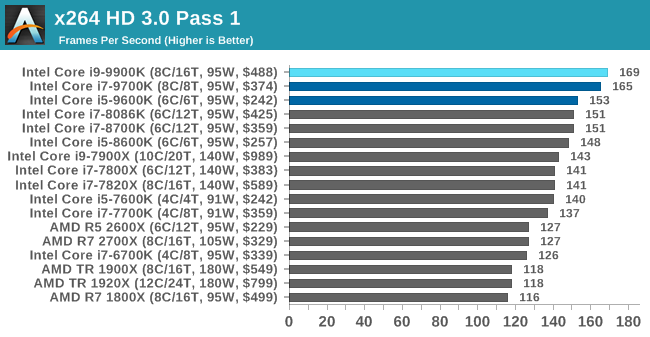
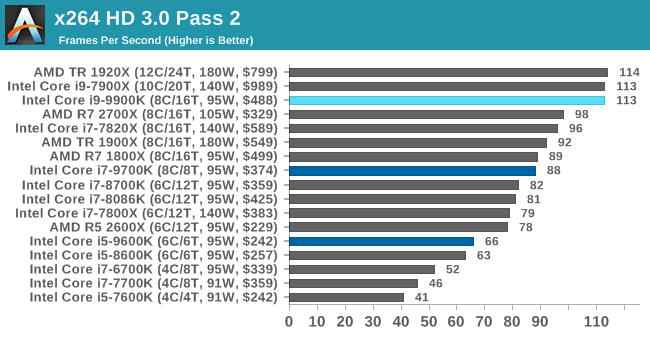
x264 HD 3.0: Older Transcode Test
This transcoding test is super old, and was used by Anand back in the day of Pentium 4 and Athlon II processors. Here a standardized 720p video is transcoded with a two-pass conversion, with the benchmark showing the frames-per-second of each pass. This benchmark is single-threaded, and between some micro-architectures we seem to actually hit an instructions-per-clock wall.


274 Comments
View All Comments
vext - Friday, October 19, 2018 - link
Very good article, but here are my beefs.Why is there no mention of temperatures?
According to Techspot the 9900k runs ridiculously hot under heavy loads. At stock clocks under a heavy Blender load it reaches 85C with a Corsair H100i Pro, or Noctua NH-D15. Pushed to 5Ghz, it hits 100C. At 5.1 Ghz it FAILS. I suggest that Anandtech has failed by not discussing this.
Techspot says:
"There’s simply no way you’re going to avoid thermal throttling without spending around $100 on the cooler, at least without your PC sounding like a jet about to take off. Throw in the Corsair H100i Pro and the 9900K now costs $700 and you still can’t overclock, at least not without running at dangerously high temperatures."
Why the focus on single threaded benchmarks? For the most part they are irrelevant. Yet they are posted in their own graph, at the front of each testing section, as though they were the most important data point. Just include them as a separate bar with the multi-thread benchmarks. Good Grief!
Why post MSRP prices in every single benchmark? You can't even buy them for MSRP. There should be a single chart at the front of the article with a rough retail estimate for each processor, and links to the retailers. If the MSRP is necessary, then just add a column to the chart. Sheesh.
Why no in depth cost/benefit comparison? A Ryzen 2600 with included cooler at $160 costs only one quarter of a 9900k with an aio cooler at $700. The $540 difference would buy a new RTX 2070 video card. Or three more Ryzen 2600's. For crying out loud.
I like the 9900k, it's a good processor. It's intended for hobbyists that can play with custom loop cooling. But it's not realistic for most people.
mapesdhs - Sunday, October 21, 2018 - link
All good questions... the silence is deafening. Thankfully, there's plenty of commentary on the value equation to be found. A small channel atm, but I like this guy's vids:https://www.youtube.com/watch?v=EWO5A9VMcyY
abufrejoval - Friday, October 19, 2018 - link
I needed something a little bigger for my lab two or three years ago and came across an E5-2696v3 on eBay from China, a Haswell generation 18-core at $700.That chips didn't officially exist, but after digging a little deeper I found it's basically an E5-2699v3 which clocks a little higher (3.8 instead of 3.6GHz) with 1-2 cores active. So it's basically a better chip for a fraction of the going price of the lesser one (E5-2699v3 is still listed at €4649 by my favorite e-tailer). And yes, it's a perfect chip, Prime95'd it for hours, POVrayd and Blendered for days until I was absolutely sure it was a prime quality chip.
Officially it has 145Watts TDP, but I've only ever seen it go to 110Watts on HWiNFO with Prime95 in its meanest settings: It must be a perfect bin. With the particle pusher it's never more than 93Watts while no part of the CPU exceeds 54°C with a Noctua 140mm fan practically inaudible at 1000rpm cooling it: That because the 18 cores and 36 threads never run faster than 2.8GHz fully loaded. They also don't drop below it (except for idle, 1.855 Watts minimum btw.), so you can pretty much forget about the 2.3GHz 'nominal' speed.
It gets 2968.245803 on that benchmark, slightly above the i9-9900k, somewhat below the ThreadRipper. That's 22nm Haswell against 14++/12nm current and 18 vs 8/12 cores.
This is rather typical for highly-threaded workloads: It's either cores or clocks and when the power ceiling is fixed you get higher throughput and energy efficiency when you can throw cores instead of clocks at the problem.
I think it's a data point worth highlighting in this crazy clock race somewhat reminiscent of Pentium 4 days, heat vs. efficiency, a four year old chip beating the newcomer in performance and almost 3:1 in efficiency at far too similar prices.
Yet, this specific chip will clock pretty high for a server chip, easily doing 3.6 GHz with eight cores seeing action from your game engine, while the remaining ten are often ignored: Perhaps that's a Ryzen effect, it used to be 4:14 earlier.
I've done BCLK overclock of 1.08 to have it reach the magic 4GHz at maximum turbo, but it's not noticeable in real-life neck-to-neck to an E3-1276v3 which also turbos to 4GHz on three cores out of four available, 3.9 at 4/4 with HT.
abufrejoval - Friday, October 19, 2018 - link
2968.245803 on the particle pusher benchmark... need editicoreaudience - Friday, October 19, 2018 - link
Move away from rar/lzma : the new darling of data compression is called Zstandard :https://www.zstd.net
It comes with a nice integrated benchmark, which can easily ramp up with multithreading :
zstd -b -1 -T8 fileToTest # benchmark level one on fileToTest using 8 threads
Windows user can even download a pre-compiled binary directly in the release notice :
https://github.com/facebook/zstd/releases/latest
It would be great to see some numbers using this compressor on latest Intel cores !
Kaihekoa - Friday, October 19, 2018 - link
Looks like all your gaming benchmarks are GPU bound and there pointless. Why not use a 2080 Ti to eliminate/reduce GPU bottleneck?Kaihekoa - Friday, October 19, 2018 - link
therefore*palladium - Friday, October 19, 2018 - link
Can you please run some SPEC2006 benchmarks and see if Apple's SOC really has caught on to Intel's performance (per core), as mentioned in Andrei in his iPhone XS review? ThanksVirpZ - Friday, October 19, 2018 - link
Apart from blender, your review is full Intel biased software for rendering.Hifihedgehog - Friday, October 19, 2018 - link
Hey Ian. I see your updated full load power consumptions results. Question: Why is it that the six-core i7-8086K is drawing so little power in comparison to everything else including the quad-cores? Is this due to its better binning or is this simply an error that crept in?