The Silicon Motion SM2262EN SSD Controller Preview: Good And Bad Amplified
by Billy Tallis on August 1, 2018 11:45 AM ESTPower Management Features
Real-world client storage workloads leave SSDs idle most of the time, so the active power measurements presented earlier in this review only account for a small part of what determines a drive's suitability for battery-powered use. Especially under light use, the power efficiency of a SSD is determined mostly be how well it can save power when idle.
For many NVMe SSDs, the closely related matter of thermal management can also be important. M.2 SSDs can concentrate a lot of power in a very small space. They may also be used in locations with high ambient temperatures and poor cooling, such as tucked under a GPU on a desktop motherboard, or in a poorly-ventilated notebook.
| SM2262EN Reference Design NVMe Power and Thermal Management Features |
|||
| Controller | Silicon Motion SM2262EN | ||
| Firmware | SVN112 | ||
| NVMe Version |
Feature | Status | |
| 1.0 | Number of operational (active) power states | 3 | |
| 1.1 | Number of non-operational (idle) power states | 2 | |
| Autonomous Power State Transition (APST) | Supported | ||
| 1.2 | Warning Temperature | 70 °C | |
| Critical Temperature | 80 °C | ||
| 1.3 | Host Controlled Thermal Management | Not Supported | |
| Non-Operational Power State Permissive Mode | Not Supported | ||
The pre-production firmware on our SM2262EN sample doesn't implement any of the NVMe 1.3 power or thermal management features, even though the current retail SM2262 drives support Host Controlled Thermal Management. The supported power states are unchanged from those on retail SM2262 drives.
| SM2262EN Reference Design NVMe Power States |
|||||
| Controller | Silicon Motion SM2262EN | ||||
| Firmware | SVN112 | ||||
| Power State |
Maximum Power |
Active/Idle | Entry Latency |
Exit Latency |
|
| PS 0 | 9.0 W | Active | - | - | |
| PS 1 | 4.6 W | Active | - | - | |
| PS 2 | 3.8 W | Active | - | - | |
| PS 3 | 45 mW | Idle | 2 ms | 2 ms | |
| PS 4 | 4 mW | Idle | 6 ms | 8 ms | |
Note that the above tables reflect only the information provided by the drive to the OS. The power and latency numbers are often very conservative estimates, but they are what the OS uses to determine which idle states to use and how long to wait before dropping to a deeper idle state.
Idle Power Measurement
SATA SSDs are tested with SATA link power management disabled to measure their active idle power draw, and with it enabled for the deeper idle power consumption score and the idle wake-up latency test. Our testbed, like any ordinary desktop system, cannot trigger the deepest DevSleep idle state.
Idle power management for NVMe SSDs is far more complicated than for SATA SSDs. NVMe SSDs can support several different idle power states, and through the Autonomous Power State Transition (APST) feature the operating system can set a drive's policy for when to drop down to a lower power state. There is typically a tradeoff in that lower-power states take longer to enter and wake up from, so the choice about what power states to use may differ for desktop and notebooks.
We report two idle power measurements. Active idle is representative of a typical desktop, where none of the advanced PCIe link or NVMe power saving features are enabled and the drive is immediately ready to process new commands. The idle power consumption metric is measured with PCIe Active State Power Management L1.2 state enabled and NVMe APST enabled if supported.
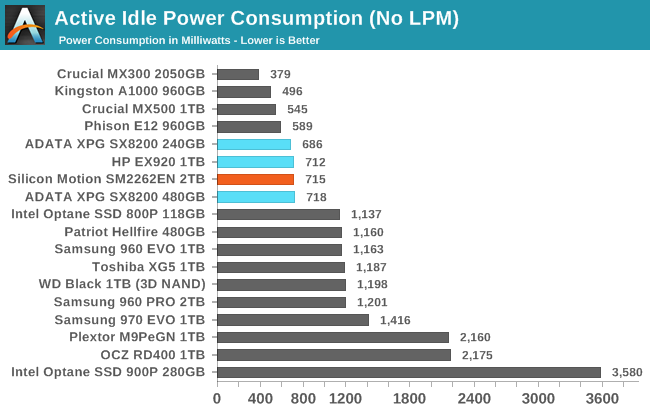
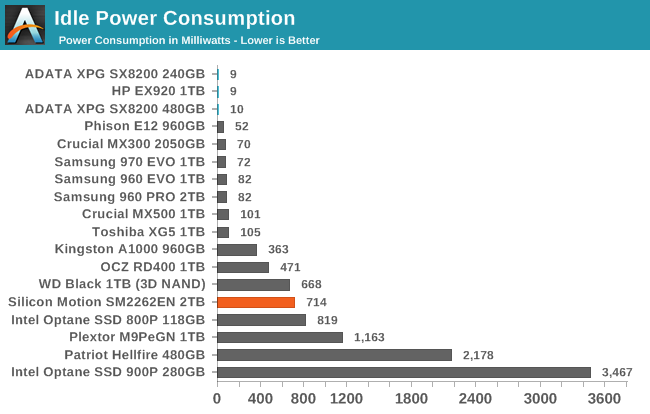
The active idle power consumption of the SM2262EN is the same as the SM2262, which is still pretty good by the standards of NVMe SSDs. However, the idle sleep states are broken on this drive, so turning on APST or even manually instructing the drive to enter one of its non-operational power states has no effect. This is a disappointing regression from the excellent power management we've seen from the SM2262, but I'm confident this issue can be fixed before drives hit the market.
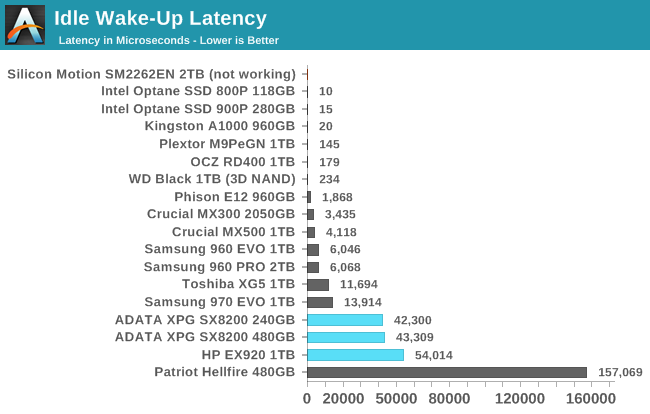
With idle power management currently broken on the SM2262EN, we can't see whether Silicon Motion has improved the wake-up latency. It's a bit high for the SM2262 drives, but since they also offer the best idle power on our testbed that can probably be forgiven.


28 Comments
View All Comments
DigitalFreak - Wednesday, August 1, 2018 - link
One thing has always confused me about these benchmarks. Does performance get progressively worse as the drive fills up? For example, the ATSB - Light average latency for the drive is 48 mu empty and 330 mu full. Does that mean when the drive is 50% full the latency would be around 189 mu? Or does it run at 48 mu until the drive hits 100% full? Same for the average data rate.Billy Tallis - Wednesday, August 1, 2018 - link
I think there's usually a threshold at which performance drops pretty rapidly because the SLC cache or spare area is no longer large enough. Unfortunately, determining the shape of the curve and where the threshold is (if there is one) is extremely time-consuming, and the tools used for the ATSB tests don't make it easy to test multiple drives in parallel.I did run the Heavy and Light tests on this drive with it 80% full and the results were similar to the 100% full case. But manual overprovisioning like that doesn't necessarily have the same impact that re-tuning the firmware would. A typical variable-size SLC cache won't be significantly larger for an 80% full drive than for a 100% full drive.
And there's still the problem that the ATSB tests don't give the drive any long idle periods to flush the SLC cache. The SLC cache on a full drive might be large enough to handle the Heavy test reasonably well if it gets a realistic amount of idle time to flush the cache mid-test. But that would take the Heavy test from 1.5 hours to a full day.
DigitalFreak - Wednesday, August 1, 2018 - link
Understandable. With the huge performance difference between empty and full with this controller, I was just curious at what percentage used the drive performance tanked. Based on your test we already know that 80% full is just as bad as 100%. Hopefully it's not any lower than that.justaviking - Wednesday, August 1, 2018 - link
I had the exact same question. How full is full?If the performance hit did not occur until 95% full or more, then it would be easily avoidable and acceptable (to me). If it happens at 30% full, it's a deal breaker. Or a linear degredation would also unacceptable to me since the degredation is so extreme.
I STRONGLY ENCOURAGE taking the time to explore the "degradation curve" relative to "fullness" for this drive, since it is so dramatic. It could make a special article of the type AnandTech excels at.
29a - Wednesday, August 1, 2018 - link
I agree.jtd871 - Wednesday, August 1, 2018 - link
How long of a "long idle time" do you need? Are you talking about 1.5h run time for ATSB to 8h or 24h with sufficiently long "long idle times"?Billy Tallis - Wednesday, August 1, 2018 - link
Currently, the ATSB tests cut all idle times down to a maximum of 25ms. I suspect that idle times on the order of seconds would be sufficient, but I don't think we even still have the original traces with the full idle times. In the near future I'll do some SYSmark runs with a mostly-full drive; that's a similar intensity of storage workload to the ATSB light, but with a fairly realistic pacing including idle.I'll also try to compare the power data against the performance test duration for the synthetic tests. That should reveal how long the drive took to return to idle after the writing stopped, and give us a pretty good idea of how quickly the drive can empty the SLC cache and how high of a duty cycle it can sustain for writes at full speed.
Dark_wizzie - Wednesday, August 1, 2018 - link
A larger drive helps mitigate the issues because 1) Larger drives tend to have large SLC cache? Or 2) There is more normal free space for the drive?Billy Tallis - Wednesday, August 1, 2018 - link
Both, in a big way when it's 2TB, and especially when you have a variable-size SLC cache. A mostly-empty 2TB drive can have over 100GB of SLC cache, which is absolutely impossible to fill up with any real-world client workload.mattrparks - Wednesday, August 1, 2018 - link
I wonder if...I think you could get similar results (stellar performance characteristics at low drive usage) by using a larger DRAM read/write cache when the drive mapping table is not taking up as much RAM. With 2GB of DDR4, let's say arbitrarily that 1.5GB of that is used by FTL page mapping tables when the drive is full. What if you found a way in firmware to manage your memory such that when most of the drive FTL is unmapped, that you could use say only 0.5GB for the mapping table and have an extra 1GB available for caching? Many of the synthetic tests could be gamed by keeping that much drive cache. I don't remember your drive testing methodology fully, but perhaps a full power cycle of the drive after the data is written, before the read tests, would make sure that all the performance is indeed SLC speed and not just enormous amounts of caching.