The Silicon Motion SM2262EN SSD Controller Preview: Good And Bad Amplified
by Billy Tallis on August 1, 2018 11:45 AM ESTMixed Random Performance
Our test of mixed random reads and writes covers mixes varying from pure reads to pure writes at 10% increments. Each mix is tested for up to 1 minute or 32GB of data transferred. The test is conducted with a queue depth of 4, and is limited to a 64GB span of the drive. In between each mix, the drive is given idle time of up to one minute so that the overall duty cycle is 50%.
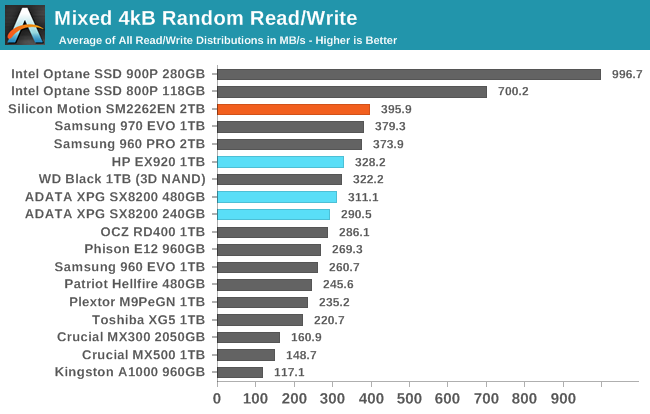
The Silicon Motion SM2262EN takes the lead among flash-based SSDs for mixed random I/O performance, though by a margin that is small enough that it may be due entirely to the capacity advantage over the 1TB 970 EVO. The performance is a clear improvement over the already-great HP EX920.
 |
|||||||||
| Power Efficiency in MB/s/W | Average Power in W | ||||||||
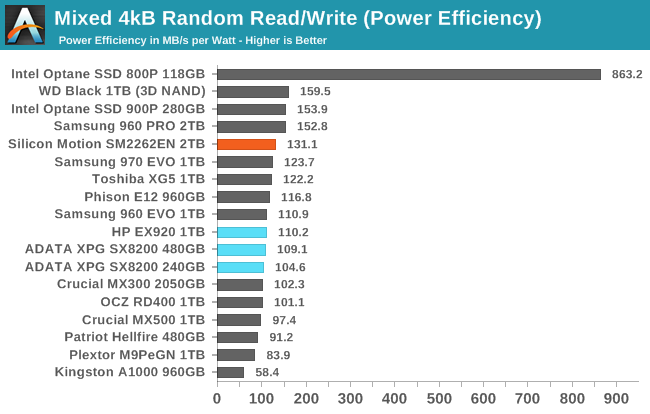
Power efficiency for the SM2262EN has improved but is not quite in the top tier for flash-based SSDs. Total power draw is higher than most SSDs, but 3W isn't a problem given the performance.
 |
|||||||||
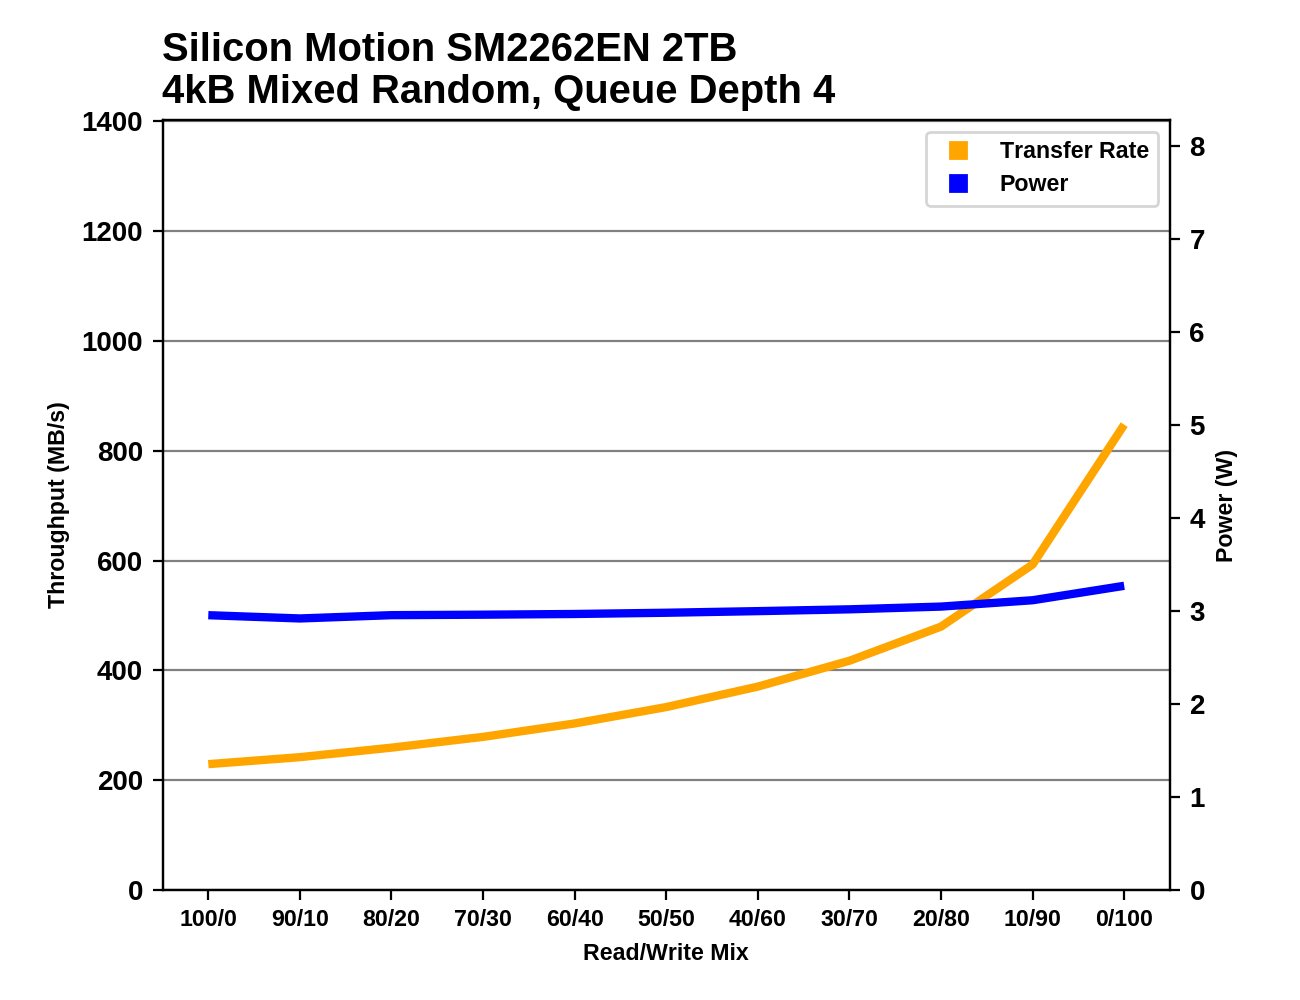
The SM2262EN shows very similar performance scaling to other top drives, with slow growth during the early phases of the test while the workload is still read-heavy, but accelerating as the proportion of writes increases. There are several drives that outperform the SM2262EN in the final phase of pure random writes, but the it tends to dominate all the earlier phases.
It is also interesting to note that power consumption barely ticks up for the final phase where the SM2262EN has a respectable spike in performance.
Mixed Sequential Performance
Our test of mixed sequential reads and writes differs from the mixed random I/O test by performing 128kB sequential accesses rather than 4kB accesses at random locations, and the sequential test is conducted at queue depth 1. The range of mixes tested is the same, and the timing and limits on data transfers are also the same as above.
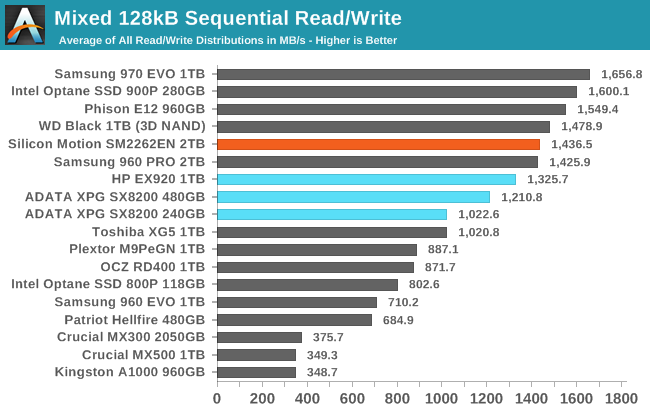
The SM2262EN is outclassed by several other TLC drives on the mixed sequential I/O test, but it is still clearly within high-end performance territory and is an improvement over the SM2262 drives.
 |
|||||||||
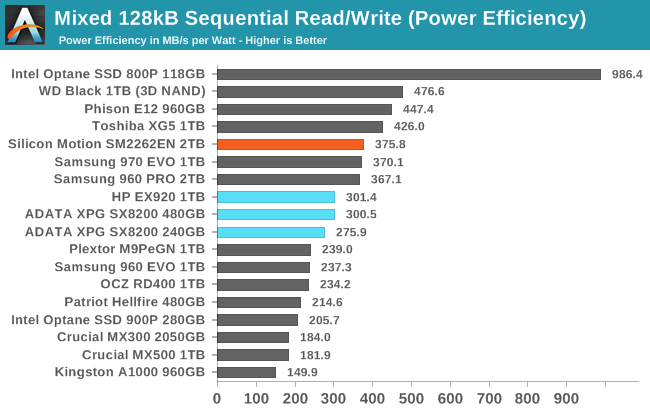
| Power Efficiency in MB/s/W | Average Power in W | ||||||||
The SM2262EN uses less power than its predecessors on this test while offering a modest performance improvement, so its efficiency score is substantially higher. However, several other TLC drives are still ahead, led by the WD Black.
 |
|||||||||
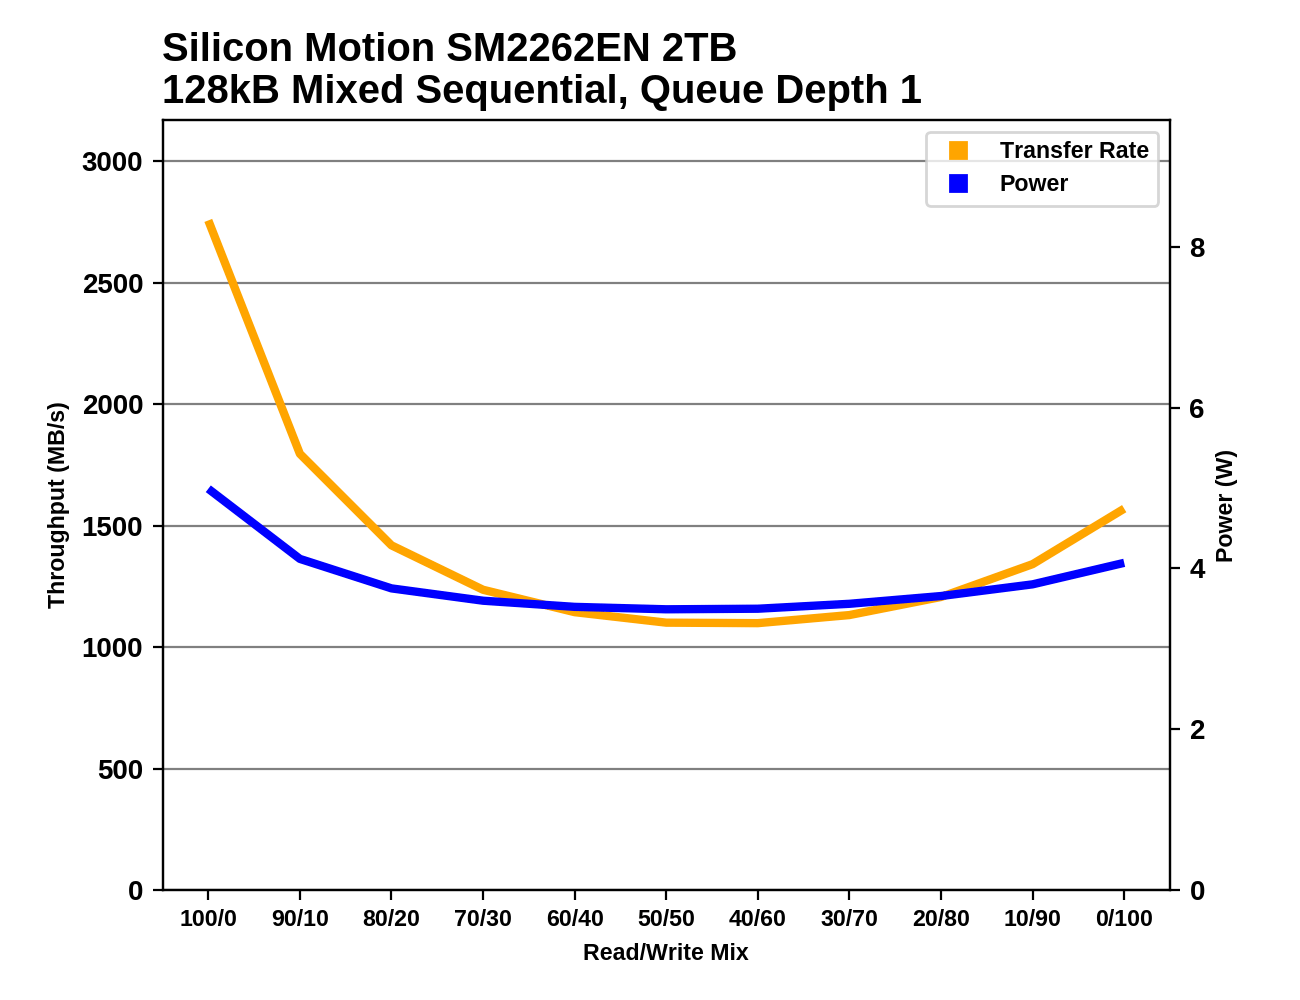
The performance scaling curve of the SM2262EN is very similar to the SM2262-based HP EX920, except that the EX920 falls behind during the more write-heavy half of the test. The SM2262EN manages to stay well above 1 GB/s throughout the test. The fastest drive run this test on is the Samsung 970 EVO, which doesn't lose performance as quickly as writes are added to the mix, but it ends up performing almost the same as the SM2262EN during the second half of the test.


28 Comments
View All Comments
DigitalFreak - Wednesday, August 1, 2018 - link
One thing has always confused me about these benchmarks. Does performance get progressively worse as the drive fills up? For example, the ATSB - Light average latency for the drive is 48 mu empty and 330 mu full. Does that mean when the drive is 50% full the latency would be around 189 mu? Or does it run at 48 mu until the drive hits 100% full? Same for the average data rate.Billy Tallis - Wednesday, August 1, 2018 - link
I think there's usually a threshold at which performance drops pretty rapidly because the SLC cache or spare area is no longer large enough. Unfortunately, determining the shape of the curve and where the threshold is (if there is one) is extremely time-consuming, and the tools used for the ATSB tests don't make it easy to test multiple drives in parallel.I did run the Heavy and Light tests on this drive with it 80% full and the results were similar to the 100% full case. But manual overprovisioning like that doesn't necessarily have the same impact that re-tuning the firmware would. A typical variable-size SLC cache won't be significantly larger for an 80% full drive than for a 100% full drive.
And there's still the problem that the ATSB tests don't give the drive any long idle periods to flush the SLC cache. The SLC cache on a full drive might be large enough to handle the Heavy test reasonably well if it gets a realistic amount of idle time to flush the cache mid-test. But that would take the Heavy test from 1.5 hours to a full day.
DigitalFreak - Wednesday, August 1, 2018 - link
Understandable. With the huge performance difference between empty and full with this controller, I was just curious at what percentage used the drive performance tanked. Based on your test we already know that 80% full is just as bad as 100%. Hopefully it's not any lower than that.justaviking - Wednesday, August 1, 2018 - link
I had the exact same question. How full is full?If the performance hit did not occur until 95% full or more, then it would be easily avoidable and acceptable (to me). If it happens at 30% full, it's a deal breaker. Or a linear degredation would also unacceptable to me since the degredation is so extreme.
I STRONGLY ENCOURAGE taking the time to explore the "degradation curve" relative to "fullness" for this drive, since it is so dramatic. It could make a special article of the type AnandTech excels at.
29a - Wednesday, August 1, 2018 - link
I agree.jtd871 - Wednesday, August 1, 2018 - link
How long of a "long idle time" do you need? Are you talking about 1.5h run time for ATSB to 8h or 24h with sufficiently long "long idle times"?Billy Tallis - Wednesday, August 1, 2018 - link
Currently, the ATSB tests cut all idle times down to a maximum of 25ms. I suspect that idle times on the order of seconds would be sufficient, but I don't think we even still have the original traces with the full idle times. In the near future I'll do some SYSmark runs with a mostly-full drive; that's a similar intensity of storage workload to the ATSB light, but with a fairly realistic pacing including idle.I'll also try to compare the power data against the performance test duration for the synthetic tests. That should reveal how long the drive took to return to idle after the writing stopped, and give us a pretty good idea of how quickly the drive can empty the SLC cache and how high of a duty cycle it can sustain for writes at full speed.
Dark_wizzie - Wednesday, August 1, 2018 - link
A larger drive helps mitigate the issues because 1) Larger drives tend to have large SLC cache? Or 2) There is more normal free space for the drive?Billy Tallis - Wednesday, August 1, 2018 - link
Both, in a big way when it's 2TB, and especially when you have a variable-size SLC cache. A mostly-empty 2TB drive can have over 100GB of SLC cache, which is absolutely impossible to fill up with any real-world client workload.mattrparks - Wednesday, August 1, 2018 - link
I wonder if...I think you could get similar results (stellar performance characteristics at low drive usage) by using a larger DRAM read/write cache when the drive mapping table is not taking up as much RAM. With 2GB of DDR4, let's say arbitrarily that 1.5GB of that is used by FTL page mapping tables when the drive is full. What if you found a way in firmware to manage your memory such that when most of the drive FTL is unmapped, that you could use say only 0.5GB for the mapping table and have an extra 1GB available for caching? Many of the synthetic tests could be gamed by keeping that much drive cache. I don't remember your drive testing methodology fully, but perhaps a full power cycle of the drive after the data is written, before the read tests, would make sure that all the performance is indeed SLC speed and not just enormous amounts of caching.