The AMD Threadripper 2990WX 32-Core and 2950X 16-Core Review
by Dr. Ian Cutress on August 13, 2018 9:00 AM ESTHEDT Benchmarks: Rendering Tests
Rendering is often a key target for processor workloads, lending itself to a professional environment. It comes in different formats as well, from 3D rendering through rasterization, such as games, or by ray tracing, and invokes the ability of the software to manage meshes, textures, collisions, aliasing, physics (in animations), and discarding unnecessary work. Most renderers offer CPU code paths, while a few use GPUs and select environments use FPGAs or dedicated ASICs. For big studios however, CPUs are still the hardware of choice.
Corona 1.3: Performance Render
An advanced performance based renderer for software such as 3ds Max and Cinema 4D, the Corona benchmark renders a generated scene as a standard under its 1.3 software version. Normally the GUI implementation of the benchmark shows the scene being built, and allows the user to upload the result as a ‘time to complete’.
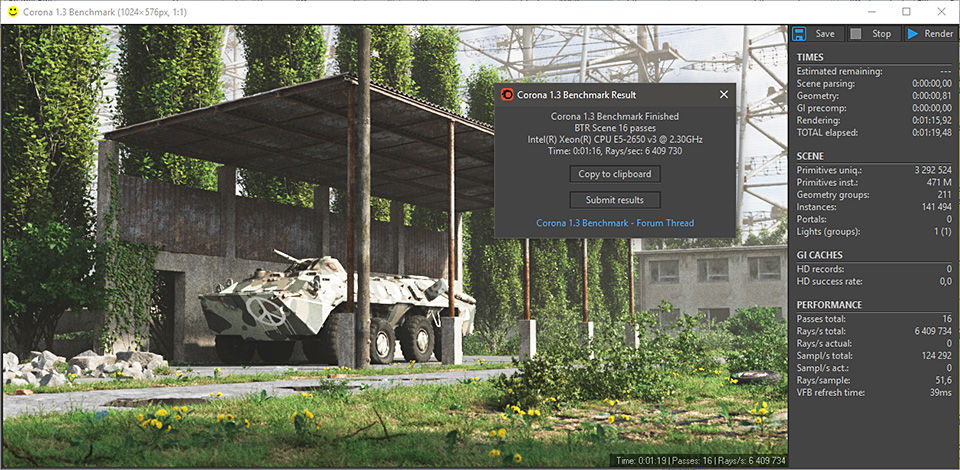
We got in contact with the developer who gave us a command line version of the benchmark that does a direct output of results. Rather than reporting time, we report the average number of rays per second across six runs, as the performance scaling of a result per unit time is typically visually easier to understand.
The Corona benchmark website can be found at https://corona-renderer.com/benchmark
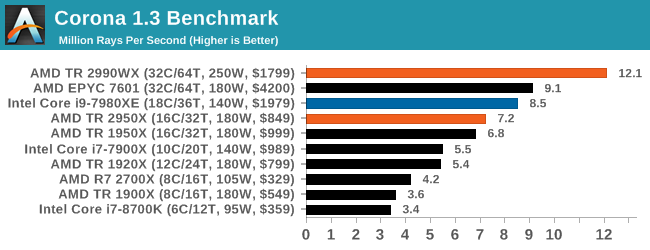
So this is where AMD broke our graphing engine. Because we report Corona in rays per second, having 12 million of them puts eight digits into our engine, which it then tries to interpret as a scientific number (1.2 x 10^7), which it can’t process in a graph. We had to convert this graph into millions of rays per second to get it to work.
The 2990WX hits out in front with 32 cores, with its higher frequency being the main reason it is so far ahead of the EPYC processor. The EPYC and Core i9 are close together, however the TR2950X at half the cost comes reasonably close.
Blender 2.79b: 3D Creation Suite
A high profile rendering tool, Blender is open-source allowing for massive amounts of configurability, and is used by a number of high-profile animation studios worldwide. The organization recently released a Blender benchmark package, a couple of weeks after we had narrowed our Blender test for our new suite, however their test can take over an hour. For our results, we run one of the sub-tests in that suite through the command line - a standard ‘bmw27’ scene in CPU only mode, and measure the time to complete the render.
Blender can be downloaded at https://www.blender.org/download/
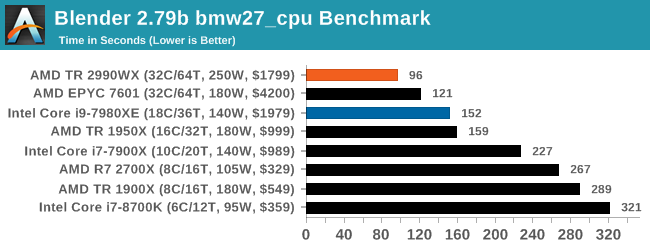
The additional cores on the 2990WX puts it out ahead of the EPYC and Core i9, with the 2990WX having an extra 58% throughput over the Core i9. That is very substantial indeed.
LuxMark v3.1: LuxRender via Different Code Paths
As stated at the top, there are many different ways to process rendering data: CPU, GPU, Accelerator, and others. On top of that, there are many frameworks and APIs in which to program, depending on how the software will be used. LuxMark, a benchmark developed using the LuxRender engine, offers several different scenes and APIs.
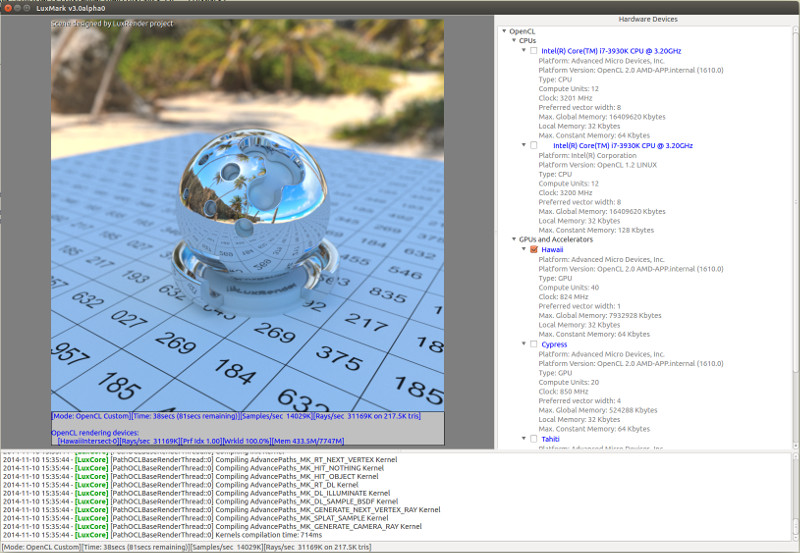
Taken from the Linux Version of LuxMark
In our test, we run the simple ‘Ball’ scene on both the C++ and OpenCL code paths, but in CPU mode. This scene starts with a rough render and slowly improves the quality over two minutes, giving a final result in what is essentially an average ‘kilorays per second’.
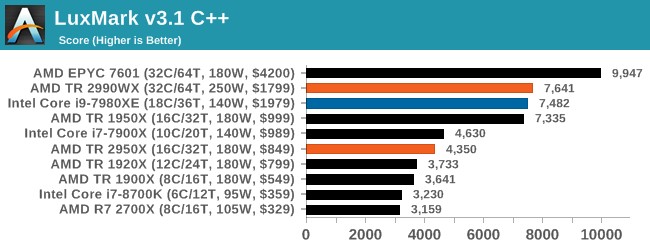
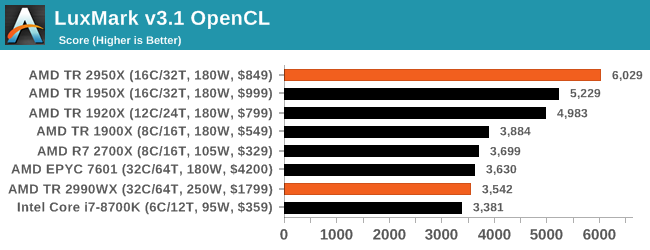
Intel’s Skylake-X processors seem to fail our OpenCL test for some reason, but in the C++ test the extra memory controllers on EPYC sets it ahead of both TR2 and Core i9. The 2990WX and Core i9 are almost equal here.
POV-Ray 3.7.1: Ray Tracing
The Persistence of Vision ray tracing engine is another well-known benchmarking tool, which was in a state of relative hibernation until AMD released its Zen processors, to which suddenly both Intel and AMD were submitting code to the main branch of the open source project. For our test, we use the built-in benchmark for all-cores, called from the command line.
POV-Ray can be downloaded from http://www.povray.org/
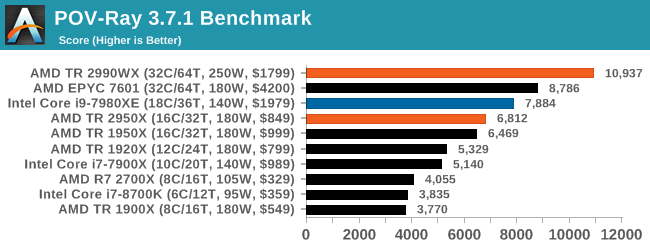
This test is another that loves the cores and frequency of the 2990WX, finishing the benchmark in almost 20 seconds. It might be time for a bigger built-in benchmark.


171 Comments
View All Comments
Lolimaster - Monday, August 13, 2018 - link
Then build one yourself.tmnvnbl - Monday, August 13, 2018 - link
How did you measure power numbers for core/uncore? Did these validate with e.g. wall measurements? The interconnect power study is very interesting, but I would like to see some more methodology there.seafellow - Monday, August 13, 2018 - link
I second the ask...how was measurement performed? How can we (the readers) have confidence in the numbers without an understanding of how the numbers were generated?GreenReaper - Wednesday, August 15, 2018 - link
Modern CPUs measure this themselves. AMD itself has boasted of the number of points at which they measure power usage throughout its new CPUs. Check out 'turbostat' in the 'linux-cpupower' package - or grab a copy of HWiNFO that will show it.Darty Sinchez - Monday, August 13, 2018 - link
This here article be awesome. I is so ready to buy. But, me no have enough money so I wait for it sale.perfmad - Monday, August 13, 2018 - link
So is the 2990WX bottlenecking in Handbrake because of the indirect memory access for some cores? Would be interesting to know if that bottleneck can be worked around by running multiple encodes simultaniously, The latest Vidcoder beta uses the handbrake core and has recently added support for multiple simultanous encodes. Would be really appreciated if you had time to look into that.Also do you share the source file and presets you use for the handbrake tests so we can run them on our hardware to get a comparison? My CPU isn't one you've tested.
Thanks for the review thus far.
AlexDaum - Monday, August 13, 2018 - link
I think, the problem with the memory bandwidth cannot be easily fixed, as it isn't a Problem, that one Process uses to much memory, but one core on one of the dies without memory controller, needs to access the infinity fabric to get Data. When all of the cores are active and want to fetch data from memory, it would cause contention on the IF Bus, which reduces the available memory bandwidth a whole lot and the core is just waiting for memory.This is just my speculation though, not based on facts, other than the bottleneck.
Aephe - Monday, August 13, 2018 - link
Those 2990WX Corona results! Can't wait to get a machine based on this baby! Holding up for TR2 release was worth it for me at least.Ian Cutress - Monday, August 13, 2018 - link
That benchmark result broke my graphing engine ! Had to start reporting it the millions.melgross - Monday, August 13, 2018 - link
It’s interesting. This reminds me of Bulldozer, where they made a bad bet with floating point (among some other things), and that held then back for years. This looks almost too specialized for most uses.