The AMD Threadripper 2990WX 32-Core and 2950X 16-Core Review
by Dr. Ian Cutress on August 13, 2018 9:00 AM ESTHEDT Benchmarks: Office Tests
The Office test suite is designed to focus around more industry standard tests that focus on office workflows, system meetings, some synthetics, but we also bundle compiler performance in with this section. For users that have to evaluate hardware in general, these are usually the benchmarks that most consider.
PCMark 10: Industry Standard System Profiler
Futuremark, now known as UL, has developed benchmarks that have become industry standards for around two decades. The latest complete system test suite is PCMark 10, upgrading over PCMark 8 with updated tests and more OpenCL invested into use cases such as video streaming.
PCMark splits its scores into about 14 different areas, including application startup, web, spreadsheets, photo editing, rendering, video conferencing, and physics. We post all of these numbers in our benchmark database, Bench, however the key metric for the review is the overall score.
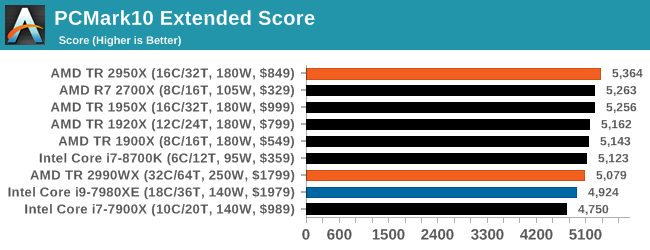
One of the downsides of PCMark is that it seems to bunch up all the results, showing them relatively close together, but interestingly here that the Intel processors sit near the bottom, with the 2950X and 2700X on the podium.
Chromium Compile: Windows VC++ Compile of Chrome 56
A large number of AnandTech readers are software engineers, looking at how the hardware they use performs. While compiling a Linux kernel is ‘standard’ for the reviewers who often compile, our test is a little more varied – we are using the windows instructions to compile Chrome, specifically a Chrome 56 build from March 2017, as that was when we built the test. Google quite handily gives instructions on how to compile with Windows, along with a 400k file download for the repo.
In our test, using Google’s instructions, we use the MSVC compiler and ninja developer tools to manage the compile. As you may expect, the benchmark is variably threaded, with a mix of DRAM requirements that benefit from faster caches. Data procured in our test is the time taken for the compile, which we convert into compiles per day.
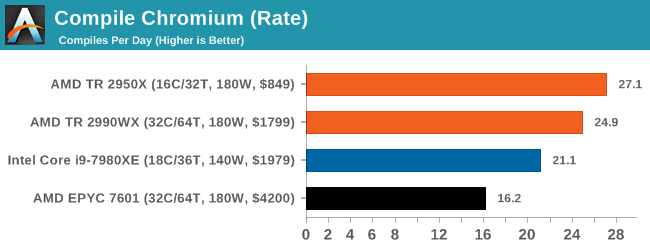
This test is such a nice mix of ST, MT, and memory limited flow that it is really interesting to see where the results end up. Unfortunately for our new suite the output files were not set up correctly, so despite running the test we only ever got a handful of results. But it shows an interesting metric: the 2950X sits ahead of the 2990WX, with both ahead of the Core i9, and the EPYC system being beaten handily due to its lower frequencies.
3DMark Physics: In-Game Physics Compute
Alongside PCMark is 3DMark, Futuremark’s (UL’s) gaming test suite. Each gaming tests consists of one or two GPU heavy scenes, along with a physics test that is indicative of when the test was written and the platform it is aimed at. The main overriding tests, in order of complexity, are Ice Storm, Cloud Gate, Sky Diver, Fire Strike, and Time Spy.
Some of the subtests offer variants, such as Ice Storm Unlimited, which is aimed at mobile platforms with an off-screen rendering, or Fire Strike Ultra which is aimed at high-end 4K systems with lots of the added features turned on. Time Spy also currently has an AVX-512 mode (which we may be using in the future).
For our tests, we report in Bench the results from every physics test, but for the sake of the review we keep it to the most demanding of each scene: Ice Storm Unlimited, Cloud Gate, Sky Diver, Fire Strike Ultra, and Time Spy.
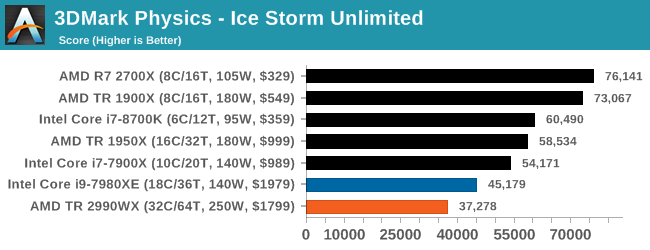
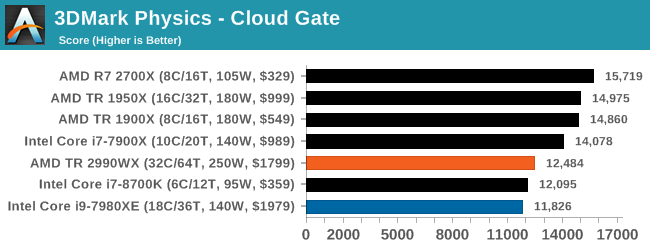
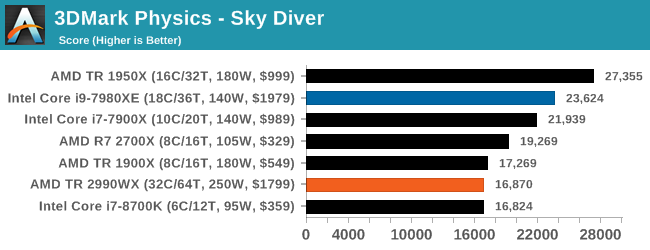
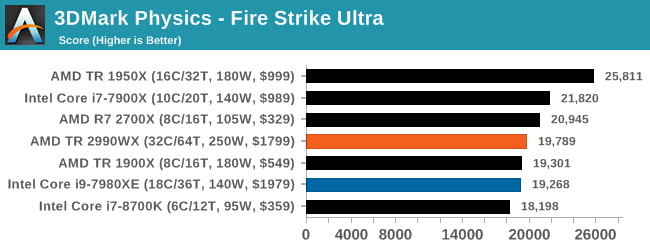
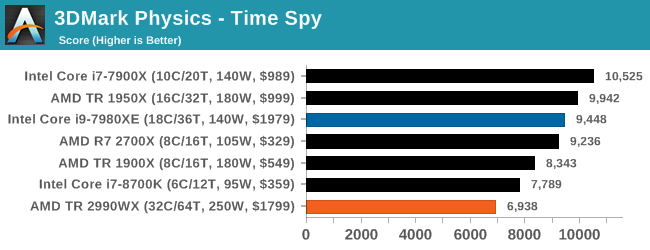
In the low end tests, it is clear that having these big processors doesn’t do much for performance, but even as we go up through Fire Strike and Time Spy, there seems to be a natural limit to the usefulness of these parts. Physics clearly loves having some extra memory bandwidth, and we know Time Spy isn’t meant to scale beyond about 10 cores, but we do see the 10 core processor sitting out front. Some of our testing sweeps had this benchmark configured incorrectly so it will be interesting to see how it fills out with some other mid and high core count processors.
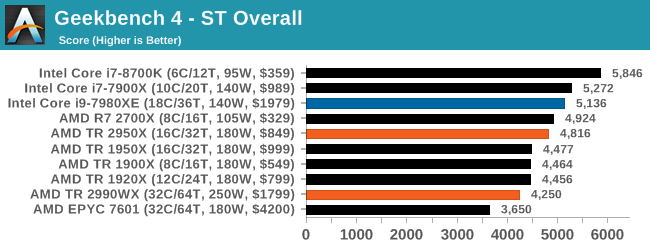
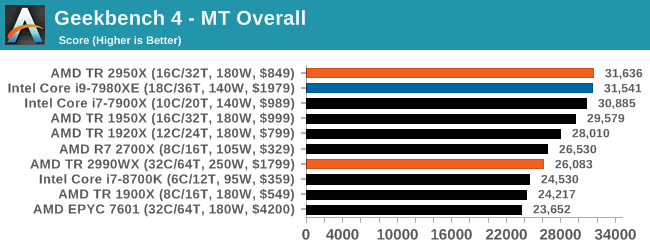
GeekBench4: Synthetics
A common tool for cross-platform testing between mobile, PC, and Mac, GeekBench 4 is an ultimate exercise in synthetic testing across a range of algorithms looking for peak throughput. Tests include encryption, compression, fast fourier transform, memory operations, n-body physics, matrix operations, histogram manipulation, and HTML parsing.
I’m including this test due to popular demand, although the results do come across as overly synthetic, and a lot of users often put a lot of weight behind the test due to the fact that it is compiled across different platforms (although with different compilers).
We record the main subtest scores (Crypto, Integer, Floating Point, Memory) in our benchmark database, but for the review we post the overall single and multi-threaded results.


171 Comments
View All Comments
edzieba - Monday, August 13, 2018 - link
Not really. In chasing Moar Cores you only excel in embarrassingly parallel workloads. And embarrassingly parallel workloads are in GPGPU's house. And GPU lives in GPGPU's house.boeush - Monday, August 13, 2018 - link
Try to run multiple VMs/Containers and/or multiple desktop sessions on a GPGPU: you might find out that GPGPU's house isn't all it's cracked up to be...SonicKrunch - Monday, August 13, 2018 - link
Look at that power consumption. I'm not suggesting AMD didn't create a really great CPU here, but they really need to work on their efficiency. It's always been their problem, and it's not seemingly going away. The market for these near 2k chips is also not huge in comparison to normal desktop space. Intel has plenty of time to answer here with their known efficiency.The_Assimilator - Monday, August 13, 2018 - link
Yeah... look at the number of cores, numpty.somejerkwad - Monday, August 13, 2018 - link
The same efficiency that has consumer-grade products operating on more electricity in per-core and per-clock comparisons? Overclocking power gets really silly on Intel's high end offerings too, if you care to look at the numbers people are getting with an i9 that has fewer cores.eddman - Monday, August 13, 2018 - link
Interesting, can you post a link, please? I've read a few reviews here and there and when comparing 2600x to 8700k (which is more or less fair), it seems in most cases 8700k consumes less energy, even though it has higher boost clocks.CrazyElf - Monday, August 13, 2018 - link
The 8700k is not the problem. It is Skylake X.https://www.tomshardware.com/reviews/-intel-skylak...
Power consumption when you OC X299 scales up quickly. Threadripper is not an 8700k competitor. It is an X299 competitor. The 32 core AMD is clearly priced to compete against the 7980X, unless Intel cuts the price.
eddman - Tuesday, August 14, 2018 - link
I should've made it clear. I was replying to the "more electricity in per-core and per-clock" part. Also, he wrote consumer-grade, which is not HEDT. I do know that TR competes with SKL-X.Comparing OCing power consumption is rather pointless when one chip is able to clock much higher.
Even when comparing 2950 to 7980, there are a lot of instances where 7980 consumes about the same power or even less. I don't see how ryzen is more efficient.
alpha754293 - Monday, August 13, 2018 - link
@ibnmadhi"It's over, Intel is finished."
Hardly.
For example, the Threadripper 2990WX (32C, 3.0 GHz) gets the highest score in POV-Ray 3.7.1 benchmark, but when you compute the efficiency, it's actually the worst for it.
It consumes more power and only gets about 114 points per (base clock * # of cores - which is a way to roughly estimate the CPU's total processing capability).
By comparison, the Intel Core i9-7980XE (18C, 2.6 GHz) is actually the MOST EFFICIENT at 168 points per (base clock * # of cores). It consumes less power than the Threadripper processors, but it does also cost more.
If I can get a system that can do as much or more for less, both in terms of capital cost and running cost (i.e. total cost of ownership), then why would I want to go AMD?
I use to run all AMD when it was a better value proposition and when Intel's power profile was much worse than AMD's. Now, it has completely flipped around.
Keep also in mind, that they kept the Epyc 7601 processor in here for comparison, a processor that costs $4200 each.
At that price, I know that I can get an Intel Xeon processor, with about the same core count and base clock speed for about the same price, but I also know that it will outperform the Epyc 7601 as well when you look at the data.
As of August, 2018, Intel has a commanding 79.4% market share compared to AMD's 20.6%. That's FARRR from Intel being over.
ender8282 - Monday, August 13, 2018 - link
base clock * number of cores seems like a poor stand in for performance per watt. If we assume that IPC and other factors like mem/cache latency are the same then sure base clock * num cores effectively gives us performance unit of power but we know those are not constant.