The AMD Threadripper 2990WX 32-Core and 2950X 16-Core Review
by Dr. Ian Cutress on August 13, 2018 9:00 AM ESTHEDT Benchmarks: System Tests
Our System Test section focuses significantly on real-world testing, user experience, with a slight nod to throughput. In this section we cover application loading time, image processing, simple scientific physics, emulation, neural simulation, optimized compute, and 3d model development, with a combination of readily available and custom software. For some of these tests, the bigger suites such as PCMark do cover them (we publish those values in our office section), although multiple perspectives is always beneficial. In all our tests we will explain in-depth what is being tested, and how we are testing.
Application Load: GIMP 2.10.4
One of the most important aspects about user experience and workflow is how fast does a system respond. A good test of this is to see how long it takes for an application to load. Most applications these days, when on an SSD, load fairly instantly, however some office tools require asset pre-loading before being available. Most operating systems employ caching as well, so when certain software is loaded repeatedly (web browser, office tools), then can be initialized much quicker.
In our last suite, we tested how long it took to load a large PDF in Adobe Acrobat. Unfortunately this test was a nightmare to program for, and didn’t transfer over to Win10 RS3 easily. In the meantime we discovered an application that can automate this test, and we put it up against GIMP, a popular free open-source online photo editing tool, and the major alternative to Adobe Photoshop. We set it to load a large 50MB design template, and perform the load 10 times with 10 seconds in-between each. Due to caching, the first 3-5 results are often slower than the rest, and time to cache can be inconsistent, we take the average of the last five results to show CPU processing on cached loading.
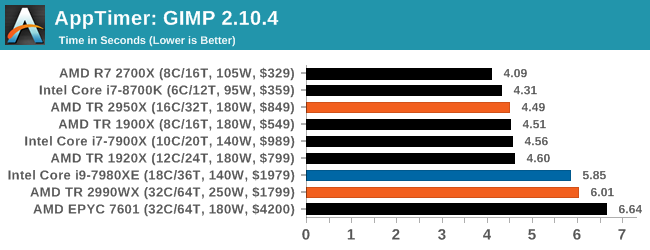
This benchmark has neatly fallen into two categories: mostly lower core count processors on one side, and the high-end desktop on the other. The 1920X and 2950X are quick, while Intel’s 18-core and the 32-core parts are slower. This is likely due to the bigger differential in single core performance, however I suspect that some of the memory latency might also be a factor here.
FCAT: Image Processing
The FCAT software was developed to help detect microstuttering, dropped frames, and run frames in graphics benchmarks when two accelerators were paired together to render a scene. Due to game engines and graphics drivers, not all GPU combinations performed ideally, which led to this software fixing colors to each rendered frame and dynamic raw recording of the data using a video capture device.
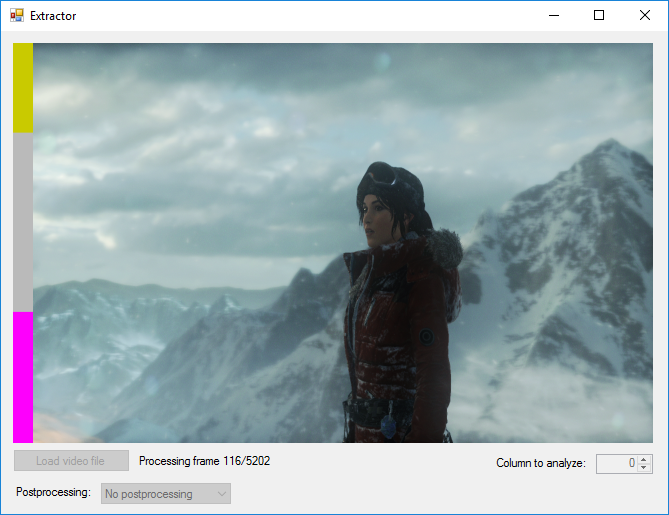
The FCAT software takes that recorded video, which in our case is 90 seconds of a 1440p run of Rise of the Tomb Raider, and processes that color data into frame time data so the system can plot an ‘observed’ frame rate, and correlate that to the power consumption of the accelerators. This test, by virtue of how quickly it was put together, is single threaded. We run the process and report the time to completion.
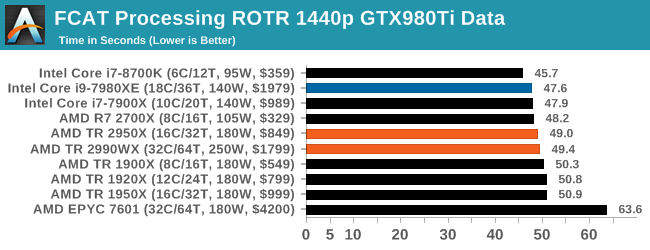
All our systems perform similarly, however Intel’s faster single threaded performance puts its processors in the lead here. The EPYC 7601 sits out back with its low single core frequency.
3D Particle Movement v2.1: Brownian Motion
Our 3DPM test is a custom built benchmark designed to simulate six different particle movement algorithms of points in a 3D space. The algorithms were developed as part of my PhD., and while ultimately perform best on a GPU, provide a good idea on how instruction streams are interpreted by different microarchitectures.
A key part of the algorithms is the random number generation – we use relatively fast generation which ends up implementing dependency chains in the code. The upgrade over the naïve first version of this code solved for false sharing in the caches, a major bottleneck. We are also looking at AVX2 and AVX512 versions of this benchmark for future reviews.
For this test, we run a stock particle set over the six algorithms for 20 seconds apiece, with 10 second pauses, and report the total rate of particle movement, in millions of operations (movements) per second.
3DPM v2.1 can be downloaded from our server: 3DPMv2.1.rar (13.0 MB)
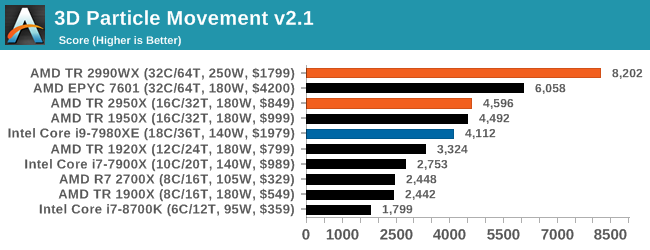
It would appear that 3DPM loves threads and frequency, with the top four spots going to AMD. Even last generation’s 16-core outperforms Intel’s 18-core in this test using non-AVX instructions. An interesting comparison here is between the 2990WX and the EPYC 7601 – the extra frequency on the consumer processor helps drive an extra 30%+ performance.
Dolphin 5.0: Console Emulation
One of the popular requested tests in our suite is to do with console emulation. Being able to pick up a game from an older system and run it as expected depends on the overhead of the emulator: it takes a significantly more powerful x86 system to be able to accurately emulate an older non-x86 console, especially if code for that console was made to abuse certain physical bugs in the hardware.
For our test, we use the popular Dolphin emulation software, and run a compute project through it to determine how close to a standard console system our processors can emulate. In this test, a Nintendo Wii would take around 1050 seconds.
The latest version of Dolphin can be downloaded from https://dolphin-emu.org/
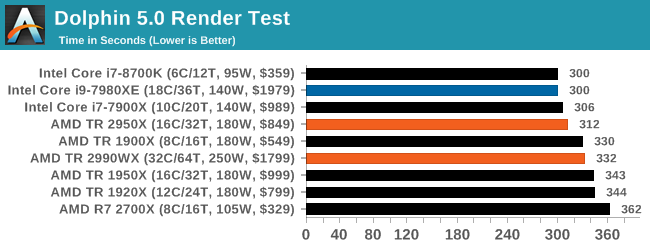
Dolphin is typically governed by single threaded performance, so Intel sits at the front here again, although having the R7 2700X at the end seems a little odd. On the off chance that this is a freak result, I should run this test again. However on the second generation TR parts, the higher clock frequency of the 2950X puts it ahead of the 2990WX by a good 20 seconds.
DigiCortex 1.20: Sea Slug Brain Simulation
This benchmark was originally designed for simulation and visualization of neuron and synapse activity, as is commonly found in the brain. The software comes with a variety of benchmark modes, and we take the small benchmark which runs a 32k neuron / 1.8B synapse simulation, equivalent to a Sea Slug.

Example of a 2.1B neuron simulation
We report the results as the ability to simulate the data as a fraction of real-time, so anything above a ‘one’ is suitable for real-time work. Out of the two modes, a ‘non-firing’ mode which is DRAM heavy and a ‘firing’ mode which has CPU work, we choose the latter. Despite this, the benchmark is still affected by DRAM speed a fair amount.
DigiCortex can be downloaded from http://www.digicortex.net/
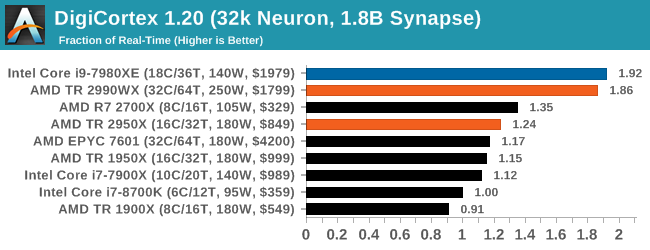
Here the quad-core processors with lots of cores have a good lead out front, however the low frequency of the EPYC 7601 puts it down the list. It would seem that the extra latency bi-modal cores in the 2990WX have not done too much damage, although you would feel that there might be extra performance to gain.
y-Cruncher v0.7.6: Microarchitecture Optimized Compute
I’ve known about y-Cruncher for a while, as a tool to help compute various mathematical constants, but it wasn’t until I began talking with its developer, Alex Yee, a researcher from NWU and now software optimization developer, that I realized that he has optimized the software like crazy to get the best performance. Naturally, any simulation that can take 20+ days can benefit from a 1% performance increase! Alex started y-cruncher as a high-school project, but it is now at a state where Alex is keeping it up to date to take advantage of the latest instruction sets before they are even made available in hardware.
For our test we run y-cruncher v0.7.6 through all the different optimized variants of the binary, single threaded and multi-threaded, including the AVX-512 optimized binaries. The test is to calculate 250m digits of Pi, and we use the single threaded and multi-threaded versions of this test.
Users can download y-cruncher from Alex’s website: http://www.numberworld.org/y-cruncher/
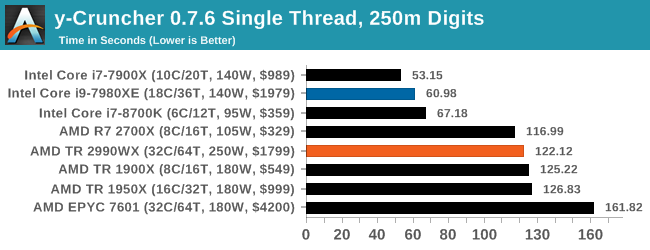
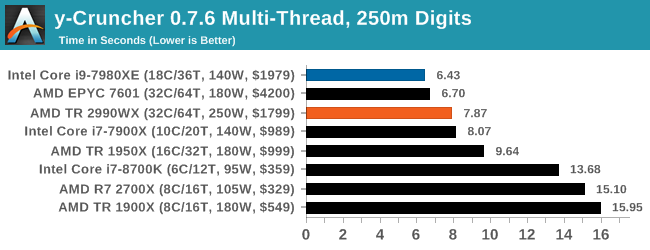
The Intel software is heavily optimized for AVX2 or AVX512, which sows in our single threaded test, however when we pile on the cores and the memory channels, both of AMD’s 32-core parts give the Core i9 a run for its money.
Agisoft Photoscan 1.3.3: 2D Image to 3D Model Conversion
One of the ISVs that we have worked with for a number of years is Agisoft, who develop software called PhotoScan that transforms a number of 2D images into a 3D model. This is an important tool in model development and archiving, and relies on a number of single threaded and multi-threaded algorithms to go from one side of the computation to the other.
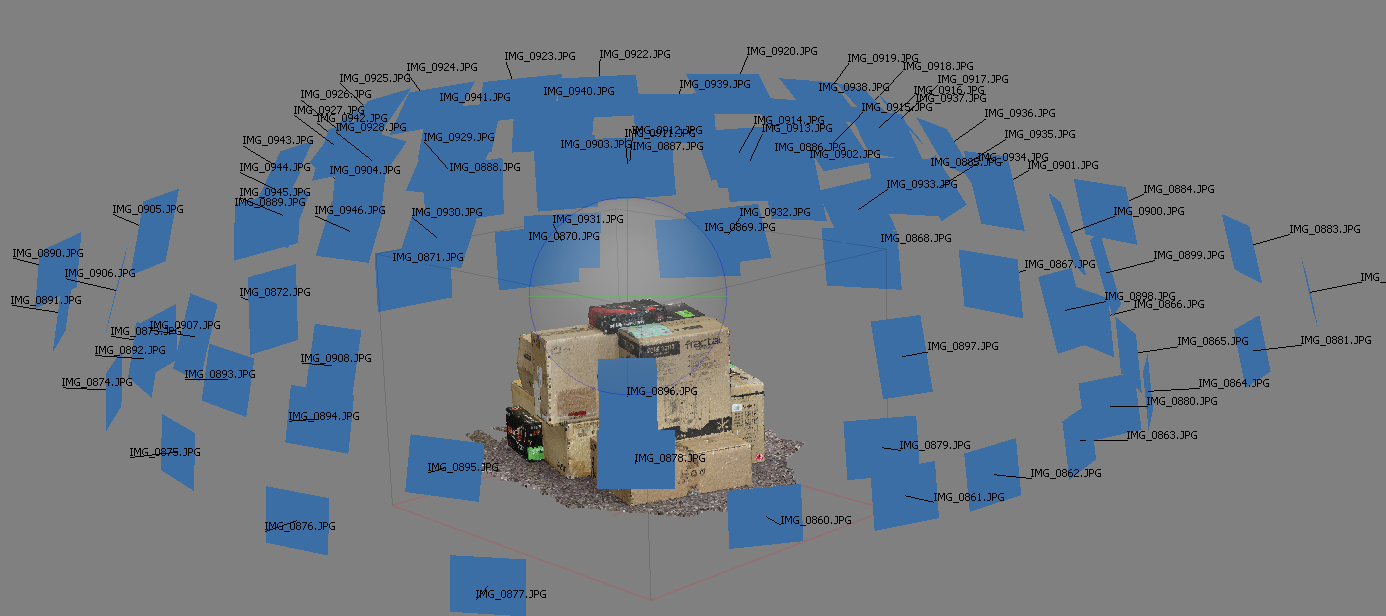
In our test, we take v1.3.3 of the software with a good sized data set of 84 x 18 megapixel photos and push it through a reasonably fast variant of the algorithms, but is still more stringent than our 2017 test. We report the total time to complete the process.
Agisoft’s Photoscan website can be found here: http://www.agisoft.com/
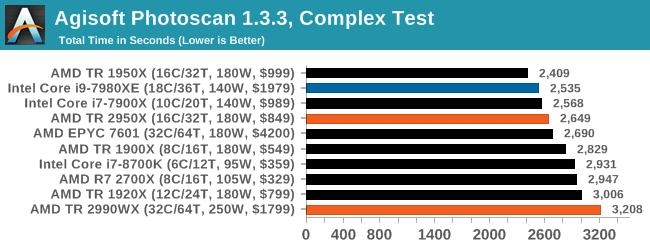
Photoscan shows a good spread, however the 2990WX is sitting at the back as it has cores that cannot access memory quick enough – the EPYC 7601 with double the memory channels operates almost 500 seconds (20%+) quicker, so if the 2990WX had extra memory, I’m sure it would shoot up the list.
Interesting the TR 1950X sits top, above the TR 2950X which has better cache latency and higher frequency in all scenarios. That’s a head scratcher.


171 Comments
View All Comments
eva02langley - Tuesday, August 14, 2018 - link
You don't get it, it is a proof of concept and a disruptive tactic to get notice for people to consider AMD in the future... and it works perfectly.KAlmquist - Thursday, August 16, 2018 - link
That's what I meant by “bragging rights.”eva02langley - Thursday, August 16, 2018 - link
You are missing the business standpoint, the stakeholders and the proof of concept.Nvidia is surfing on AI, however the only thing they did so far is selling GPU during a mining craze, however people drink their coolaid and the investors are all over them. The hangover is going to be hard.
Lolimaster - Monday, August 13, 2018 - link
If you're a content creator the Threaripper 2950X is you bitch, period.MrSpadge - Tuesday, August 14, 2018 - link
Ian, does the power consumption of uncore (IF + memory controller) scale with IF + memory controller frequency? I would expect so. And if not: maybe AMD is missing on huge possible power savings at lower frequencies. Not sure if overall efficiency could benefit from that, though, as performance and power would simulataneously regress.dynamis31 - Tuesday, August 14, 2018 - link
It's not all silicon !Windows OS and applications running on that OS may also be software optimised for more 2990WX workloads as you can see below :
https://www.phoronix.com/forums/forum/phoronix/lat...
dmayo - Tuesday, August 14, 2018 - link
Meanwhile, in Linux 2990WX destroyed competition.https://www.phoronix.com/scan.php?page=article&...
https://www.phoronix.com/scan.php?page=article&...
eva02langley - Tuesday, August 14, 2018 - link
I am beginning to ask myself if this is related to Windows. Or maybe the bench suites reliability toward such a unique product.But yeah, these results are insane.
MrSpadge - Tuesday, August 14, 2018 - link
Crazy results, indeed. And quite believable, considering how well the 16 core TR fares in comparison in many windows benches. I suspect the scheduler is not yet tuned for the new architecture with 2 different NUMA levels.And for at least parts of the benchmarks I suspect something a lot less technical is happening: Phoronix can only bench cross-platform software for this comparison. However, hardly any Windows programmer is regularly building Linux versions. That leaves just another option: Linux programs which also got a Windows build. And considering how downright hostile Linux fans can be towards Windows and anything Microsoft-related, I wouldn't be surprised if the tuning going into these compilations was far from ideal. Some of these guys really enjoy shouting out loud that they don't have access to any Windows machine to test their build (which they only did to stop the requests flooding their inbox) and to shove down their users throat that Windows is a second class citizen in their world. This point is reinforced by the wierd names of many of the benchmarks - except 7-zip, is anyone using those programs?
GreenReaper - Wednesday, August 15, 2018 - link
Most aren't dedicated benchmarks, they're useful programs being run as such:* x264 powers most CPU-based H.264/AVC video encoding. Steam uses it, for example.
* GraphicsMagick is a fork of ImageMagick, one of which is used in a large number of websites (probably including this one) for processing images.
* FFmpeg is for audio and video processing.
* Blender is a popular open-source rendering tool.
* Minion is for constraint-solving (e.g. the four-colour map problem).
Many aren't the kind of things you'd run on a regular desktop - but a workstation, sure. They are CPU-intensive parallel tasks which scale - or you hope will scale - with threads.