The Intel SSD 660p SSD Review: QLC NAND Arrives For Consumer SSDs
by Billy Tallis on August 7, 2018 11:00 AM ESTSequential Read Performance
Our first test of sequential read performance uses short bursts of 128MB, issued as 128kB operations with no queuing. The test averages performance across eight bursts for a total of 1GB of data transferred from a drive containing 16GB of data. Between each burst the drive is given enough idle time to keep the overall duty cycle at 20%.
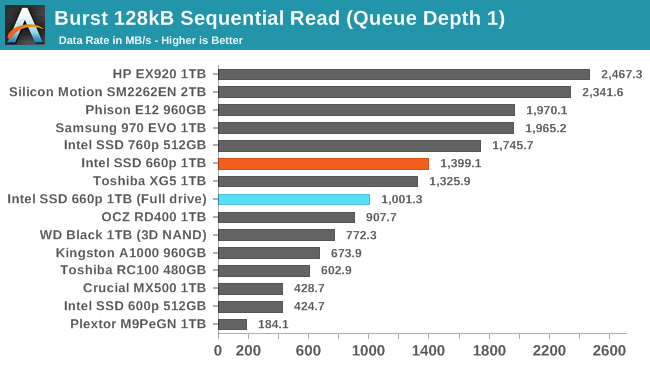
The burst sequential read performance of the Intel SSD 660p is lower than several of the fastest high-end drives, but is still pretty quick given the 4-channel controller used by the 660p. The read speed is only moderately impaired after filling the drive all the way.
Our test of sustained sequential reads uses queue depths from 1 to 32, with the performance and power scores computed as the average of QD1, QD2 and QD4. Each queue depth is tested for up to one minute or 32GB transferred, from a drive containing 64GB of data. This test is run twice: once with the drive prepared by sequentially writing the test data, and again after the random write test has mixed things up, causing fragmentation inside the SSD that isn't visible to the OS. These two scores represent the two extremes of how the drive would perform under real-world usage, where wear leveling and modifications to some existing data will create some internal fragmentation that degrades performance, but usually not to the extent shown here.
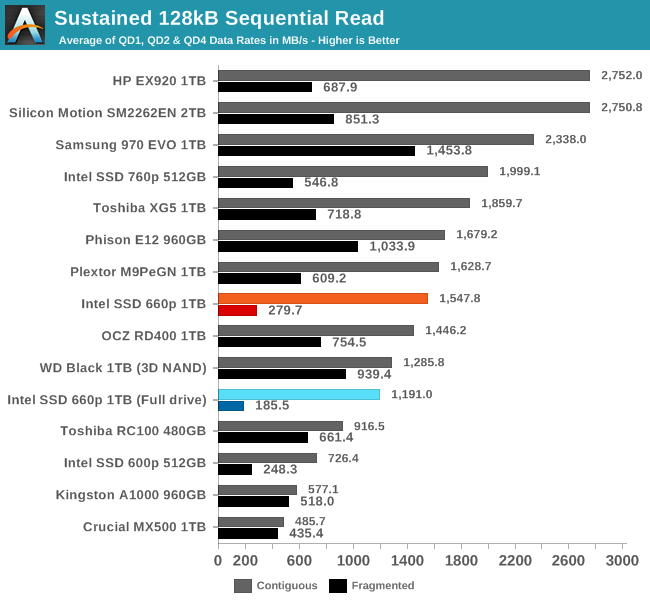
On the longer sequential read test that goes beyond QD1, the true high-end NVMe drives pull away from the 660p but it is still faster than most other low-end NVMe SSDs. Internal fragmentation is more of a problem for the 660p than the TLC drives, but this is not too surprising—the QLC NAND is likely using larger page and block sizes that add to the overhead of gathering data that has been dispersed by wear leveling during random writes.
 |
|||||||||
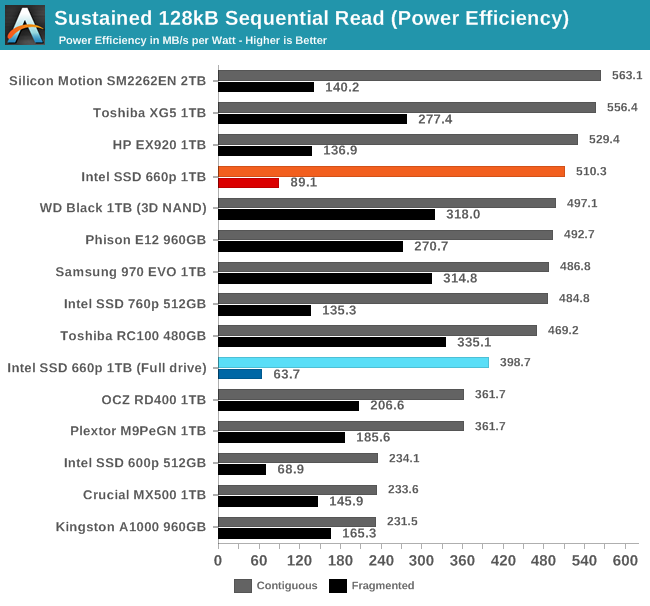
| Power Efficiency in MB/s/W | Average Power in W | ||||||||
The power efficiency of sequential reads from the 660p is competitive with many of the best TLC SSDs, and isn't too far behind even after filling the drive all the way.
 |
|||||||||
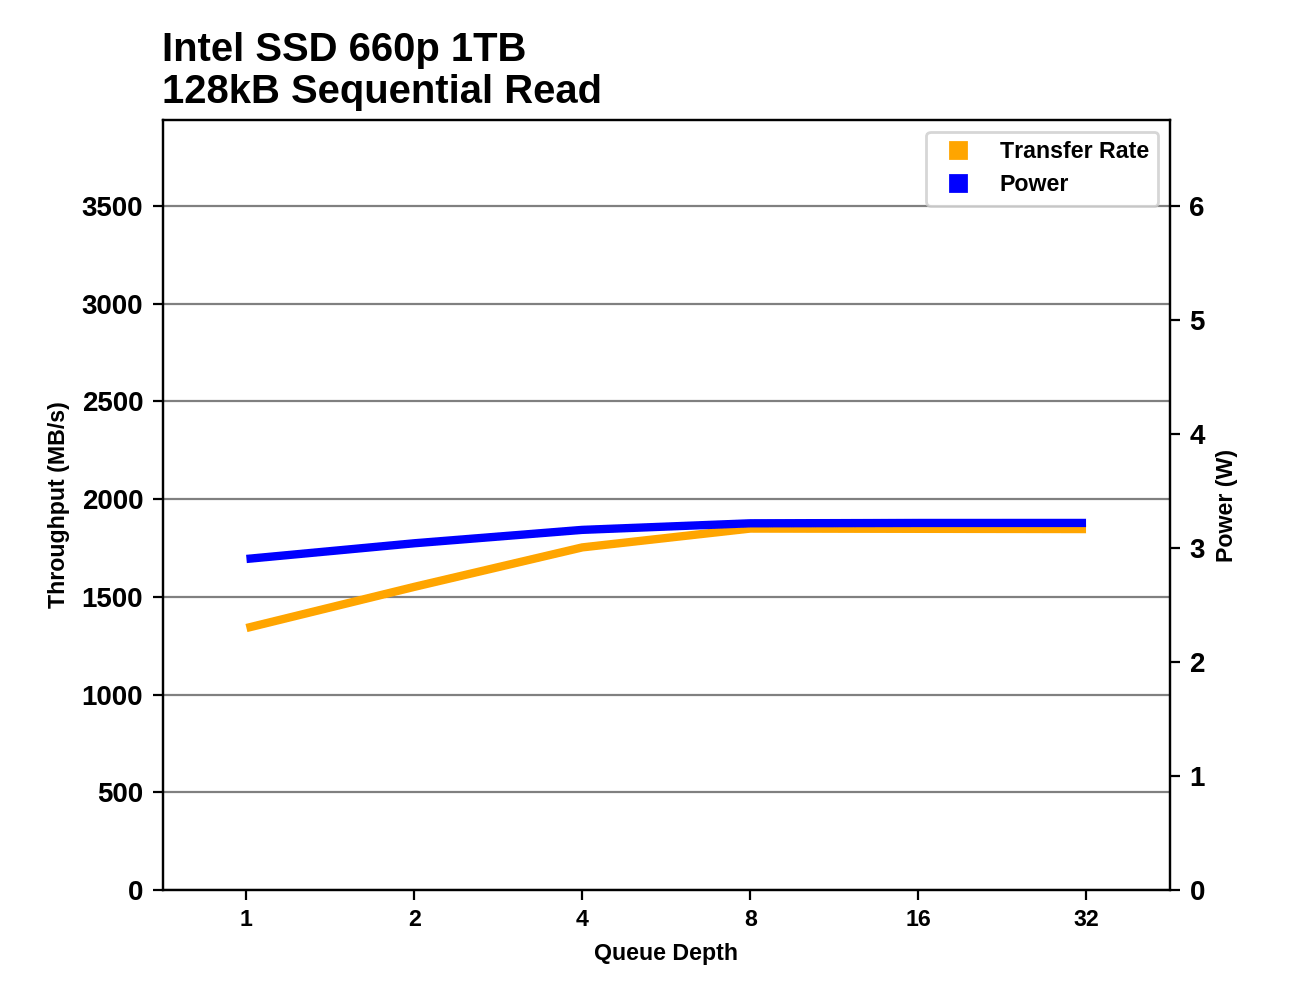
The 660p doesn't reach its maximum sequential read speed until around QD8, but it was already pretty quick at QD1 so the overall growth is relatively small.
Sequential Write Performance
Our test of sequential write burst performance is structured identically to the sequential read burst performance test save for the direction of the data transfer. Each burst writes 128MB as 128kB operations issued at QD1, for a total of 1GB of data written to a drive containing 16GB of data.
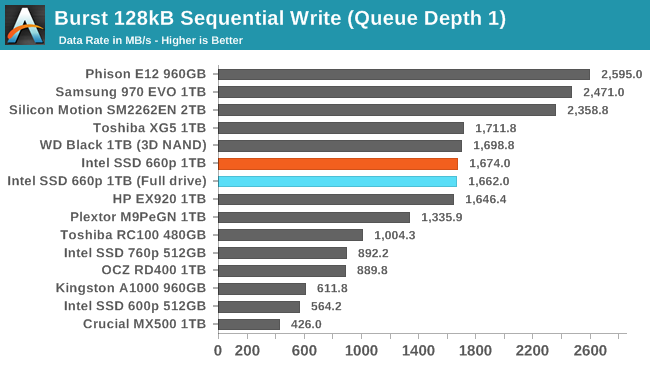
The burst sequential write test only hits the SLC write cache even when the Intel SSD 660p is completely full, so it performs comparably to many high-end NVMe drives.
Our test of sustained sequential writes is structured identically to our sustained sequential read test, save for the direction of the data transfers. Queue depths range from 1 to 32 and each queue depth is tested for up to one minute or 32GB, followed by up to one minute of idle time for the drive to cool off and perform garbage collection. The test is confined to a 64GB span of the drive.
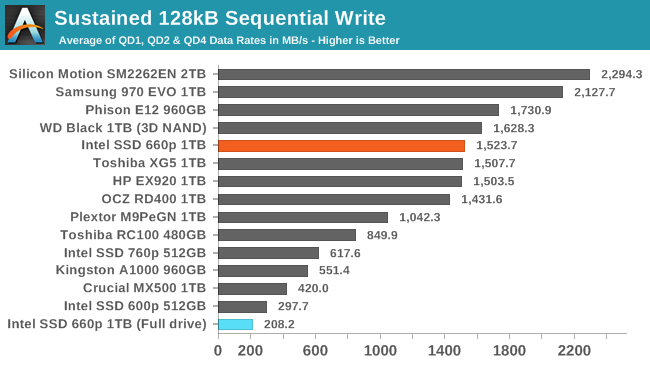
Our usual test conditions of a mostly-empty drive mean that the 660p's score on the sustained sequential write test reflects only writes to the SLC cache at its largest configuration. When the drive is full and the SLC cache has shrunk to just 12GB, the test quickly fills that cache and performance drops to last place.
 |
|||||||||
| Power Efficiency in MB/s/W | Average Power in W | ||||||||
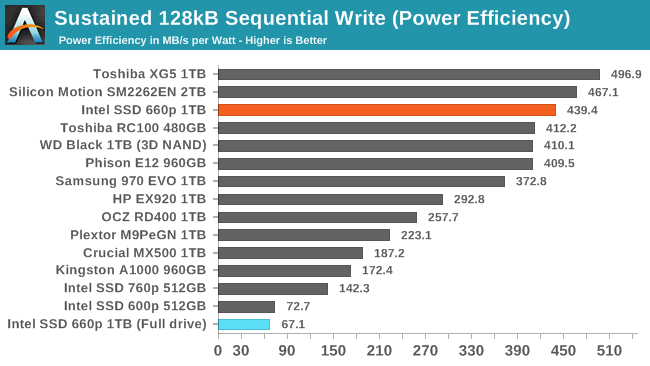
The power efficiency of the 660p when writing sequentially to the SLC cache is excellent, but it ends up slightly worse off than the 600p when the drive is full and the SLC cache is too small.
 |
|||||||||
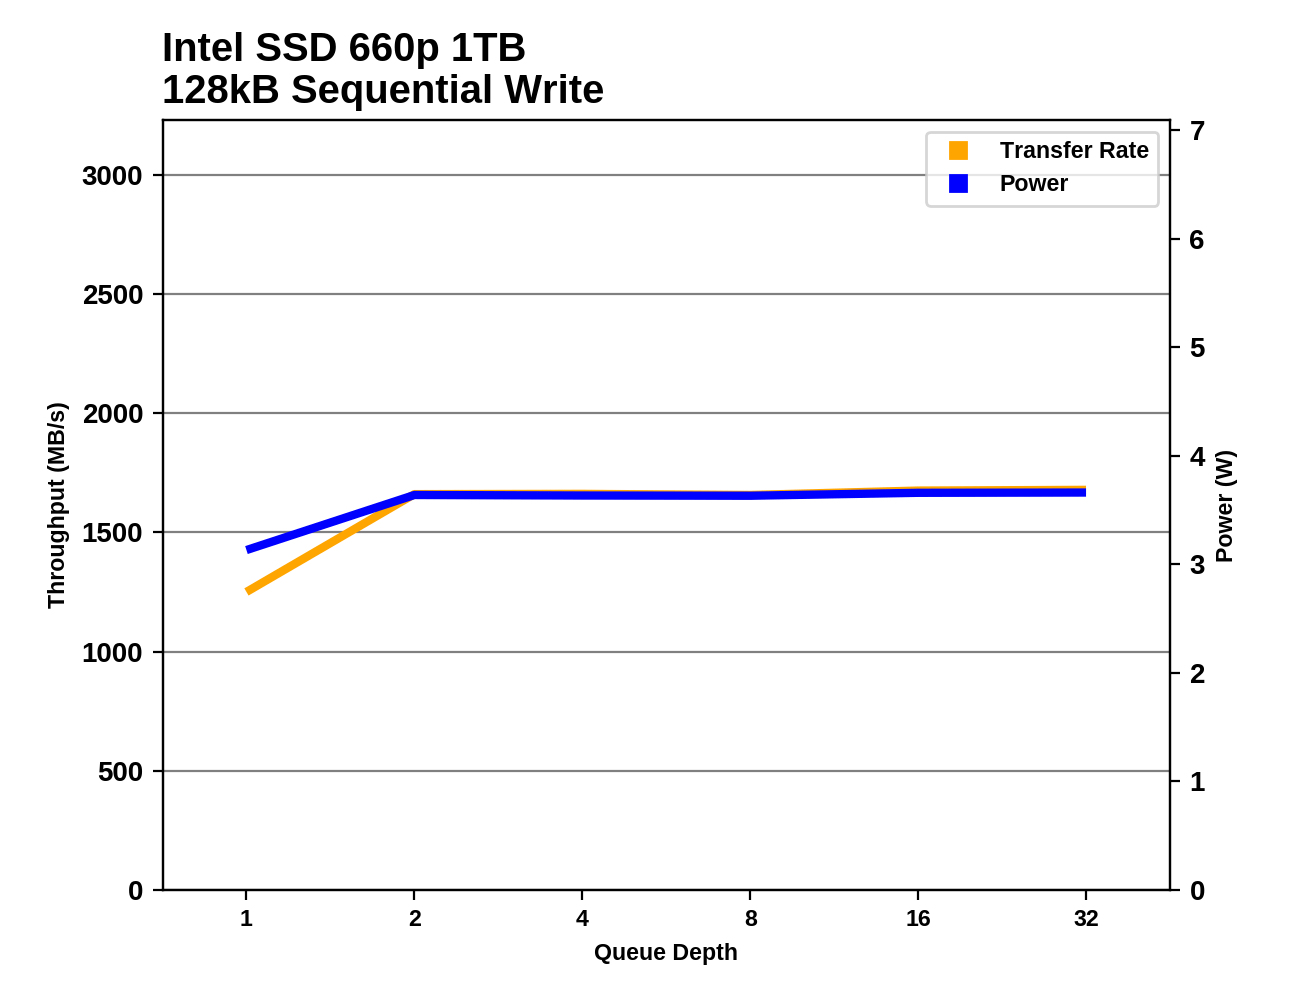
The 660p reaches its maximum sequential write speed at QD2 and maintains it for the rest of the test, showing that the drive is largely keeping up with flushing the SLC write cache during the idle phases of the test.


86 Comments
View All Comments
StrangerGuy - Tuesday, August 7, 2018 - link
"I am a TRUE PROFESSIONAL who can't pay more endurance for my EXTREME SSD WORKLOADS by either from my employer or by myself, I'm the poor 0.01% who is being oppressed by QLC!"Oxford Guy - Tuesday, August 7, 2018 - link
Memes didn't make the IBM Deathstar drives fun and games.StrangerGuy - Tuesday, August 7, 2018 - link
I'm sure you were the true prophetic one warning us about those crappy those 75GXPs before they were released, oh wait.I'm sorry why are you here and why should anyone listen to you again?
Oxford Guy - Tuesday, August 7, 2018 - link
Memes and trolling may be entertaining but this isn't really the place for it.jjj - Tuesday, August 7, 2018 - link
Not bad, at least for now when there are no QLC competitors.The pressure QLC will put on HDDs is gonna be interesting too.
damianrobertjones - Tuesday, August 7, 2018 - link
These drives will fill the bottom end... allowing the mid and high tiers to increase in price. Usual.Valantar - Wednesday, August 8, 2018 - link
Only if the performance difference is large enough to make them worth it - which it isn't, at least in this case. While the advent of TLC did push MLC prices up (mainly due to reduced production and sales volume), it seems unlikely for the same to happen here, as these drives aim for a market segment that has so far been largely unoccupied. (It's also worth mentioning here that silicon prices have been rising for quite a while, and also affects this.) There are a few TLC drives in the same segment, but those are also quite bad. This, on the other hand, competes with faster drives unless you fill it or the SLC cache. In other words, higher-end drives will have to either aim for customers with heavier workloads (which might imply higher prices, but would also mean optimizations for non-consumer usage scenarios) or push prices lower to compete.romrunning - Wednesday, August 8, 2018 - link
Well, QLC will slowly push out TLC, which was already pushing out MLC. It's not just pushing the prices of MLC/TLC up, mfgs are slowing phasing those lines out entirely. So even if I want a specific type, I may not be able to purchase it in consumerspace (maybe enterprise, with the resultant price hit).I hate that we're getting lower-performing items for the cheaper price - I'd rather get higher-performing at cheaper prices! :)
rpg1966 - Tuesday, August 7, 2018 - link
"In the past year, the deployment of 64-layer 3D NAND flash has allowed almost all of the SSD industry to adopt three bit per cell TLC flash"What does this mean? n-layer NAND isn't a requirement for TLC is it?
Ryan Smith - Tuesday, August 7, 2018 - link
3D NAND is not a requirement for TLC. However most of the 32/48 layer processes weren't very good, resulting in poorly performing TLC NAND. The 64 layer stuff has turned out much better, finally making TLC viable from all manufacturers.