The Intel Core i7-8086K Review
by Ian Cutress on June 11, 2018 8:00 AM EST- Posted in
- CPUs
- Intel
- Core i7
- Anniversary
- Coffee Lake
- i7-8086K
- 5 GHz
- 8086K
- 5.0 GHz
Benchmarking Performance: CPU System Tests
Our first set of tests is our general system tests. These set of tests are meant to emulate more about what people usually do on a system, like opening large files or processing small stacks of data. This is a bit different to our office testing, which uses more industry standard benchmarks, and a few of the benchmarks here are relatively new and different.
All of our benchmark results can also be found in our benchmark engine, Bench.
FCAT Processing: link
One of the more interesting workloads that has crossed our desks in recent quarters is FCAT - the tool we use to measure stuttering in gaming due to dropped or runt frames. The FCAT process requires enabling a color-based overlay onto a game, recording the gameplay, and then parsing the video file through the analysis software. The software is mostly single-threaded, however because the video is basically in a raw format, the file size is large and requires moving a lot of data around. For our test, we take a 90-second clip of the Rise of the Tomb Raider benchmark running on a GTX 980 Ti at 1440p, which comes in around 21 GB, and measure the time it takes to process through the visual analysis tool.
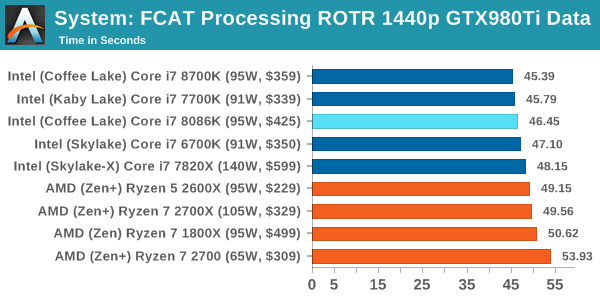
FCAT is single threaded, however in this test the full 5.0 GHz did not kick in.
Dolphin Benchmark: link
Many emulators are often bound by single thread CPU performance, and general reports tended to suggest that Haswell provided a significant boost to emulator performance. This benchmark runs a Wii program that ray traces a complex 3D scene inside the Dolphin Wii emulator. Performance on this benchmark is a good proxy of the speed of Dolphin CPU emulation, which is an intensive single core task using most aspects of a CPU. Results are given in minutes, where the Wii itself scores 17.53 minutes.
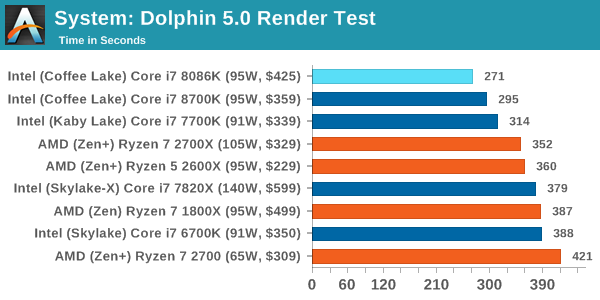
For a test that did have 5.0 GHz kick in, the 8086K takes the record in our Dolphin test.
3D Movement Algorithm Test v2.1: link
This is the latest version of the self-penned 3DPM benchmark. The goal of 3DPM is to simulate semi-optimized scientific algorithms taken directly from my doctorate thesis. Version 2.1 improves over 2.0 by passing the main particle structs by reference rather than by value, and decreasing the amount of double->float->double recasts the compiler was adding in. It affords a ~25% speed-up over v2.0, which means new data.
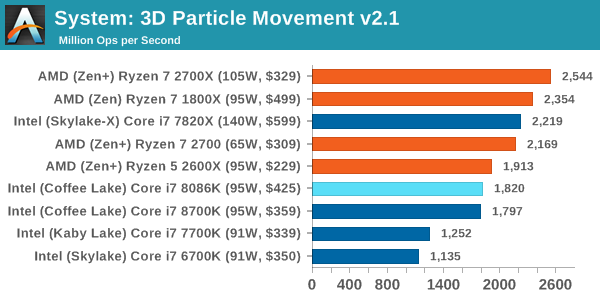
On 3DPM, the 8086K shows that the 4.3 GHz all-core is on par with the 8700K.
DigiCortex v1.20: link
Despite being a couple of years old, the DigiCortex software is a pet project for the visualization of neuron and synapse activity in the brain. The software comes with a variety of benchmark modes, and we take the small benchmark which runs a 32k neuron/1.8B synapse simulation. The results on the output are given as a fraction of whether the system can simulate in real-time, so anything above a value of one is suitable for real-time work. The benchmark offers a 'no firing synapse' mode, which in essence detects DRAM and bus speed, however we take the firing mode which adds CPU work with every firing.
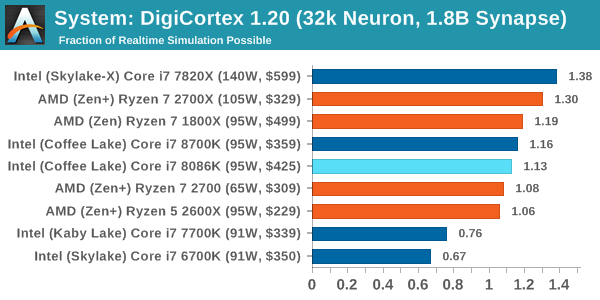
Despite the faster single core frequency, this DRAM-limited test seems to load up another core and stops the 8086K from reaching 5.0 GHz.
Agisoft Photoscan 1.3.3: link
Photoscan stays in our benchmark suite from the previous version, however now we are running on Windows 10 so features such as Speed Shift on the latest processors come into play. The concept of Photoscan is translating many 2D images into a 3D model - so the more detailed the images, and the more you have, the better the model. The algorithm has four stages, some single threaded and some multi-threaded, along with some cache/memory dependency in there as well. For some of the more variable threaded workload, features such as Speed Shift and XFR will be able to take advantage of CPU stalls or downtime, giving sizeable speedups on newer microarchitectures.
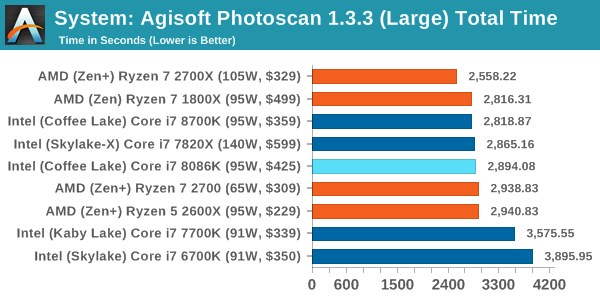
Agisoft is variable threaded, but the 8086K is still a small stones throw from the 8700K.


111 Comments
View All Comments
peevee - Monday, June 11, 2018 - link
8086 being slower than 8700 just indicates an error in your methodology.For example, one has updated microcode for exploits and another does not.
TheinsanegamerN - Monday, June 18, 2018 - link
OOORrrrr....its a different motherboard, not the usual test bed. The motherboard used for this is an asrock board, which explains the difference in performance.Memo.Ray - Monday, June 11, 2018 - link
As I mentioned in my comment in the other article a couple of days ago:Intel managed to give away 8086 "binned" 8700K (AKA 8086K) and still make some money on top of it. win-win situation :D
https://www.anandtech.com/comments/12940/intels-co...
Xenphor - Monday, June 11, 2018 - link
How did they get such a lower score on the Dolphin benchmark with a 5ghz overclock on the 8086k? Isn't the benchmark single core only and considering the 8086 already turbos to 5ghz on a single core, why would there be that much of a difference? I tried it on my 8700k at 5ghz and only get a score of about 265-270 with 2666mhz ram.Ian Cutress - Monday, June 11, 2018 - link
The 5.0 GHz turbo, at stock, doesn't kick in that often. Depends on how the software sets its own affinity, and most do not. This is the danger with only single core turbo - with all the modern software in the background, even with Windows and scheduling, you rarely hit single core Turbo.Xenphor - Monday, June 11, 2018 - link
I suppose but even on the Dolphin forums spreadsheet the highest score is a 249 which is a 7700k at 5.2ghz.Ian Cutress - Tuesday, June 12, 2018 - link
I'll retest when I'm back home at the end of the week and recovered from jet lagXenphor - Tuesday, June 12, 2018 - link
Well don't feel like you have to. Just thought it was weird.Vatharian - Monday, June 11, 2018 - link
7 years ago, first batches of Core i7-2600K (like mine) were able to reach stable 5.0-5.2 GHz on water, on all 4 cores. Given 7 years difference and 32 vs 14 nm, I am maybe not disappointed (there are +2 cores, half a CPU more), but rather not amused. IPC is higher, that's one, DDR4 can reach 3 times higher frequencies than DDR3, that's two, so there are improvements, but given the bovine excrement that goes on chipset side and PCI-Express connectivity it's clear to see the stagnation.SanX - Monday, June 11, 2018 - link
Total flop. The processor in your phone is probably more hi-tech, has more transistors, more cores, and was made on more advances factories with 10nm litho being all sold below $25.