The AMD 2nd Gen Ryzen Deep Dive: The 2700X, 2700, 2600X, and 2600 Tested
by Ian Cutress on April 19, 2018 9:00 AM ESTCPU Office Tests
The office programs we use for benchmarking aren't specific programs per-se, but industry standard tests that hold weight with professionals. The goal of these tests is to use an array of software and techniques that a typical office user might encounter, such as video conferencing, document editing, architectural modelling, and so on and so forth.
All of our benchmark results can also be found in our benchmark engine, Bench.
Chromium Compile (v56)
Our new compilation test uses Windows 10 Pro, VS Community 2015.3 with the Win10 SDK to combile a nightly build of Chromium. We've fixed the test for a build in late March 2017, and we run a fresh full compile in our test. Compilation is the typical example given of a variable threaded workload - some of the compile and linking is linear, whereas other parts are multithreaded.
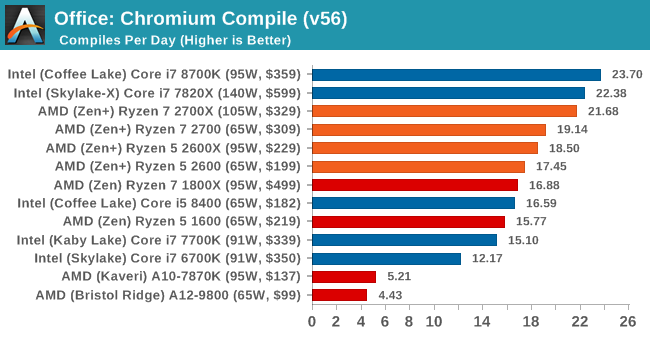
Having redone our compile testing, we can see that the new Ryzen-2000 series parts do provide a good uplift over the first generation, likely due to the decreased cache latencies and better precision boost. Performance per dollar between the 8700K and the 2700X would seem to be about equal as well.
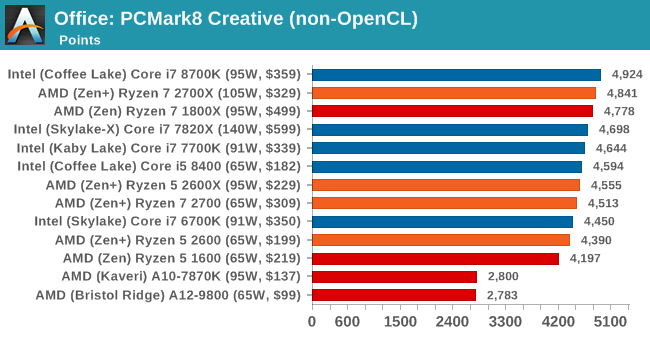
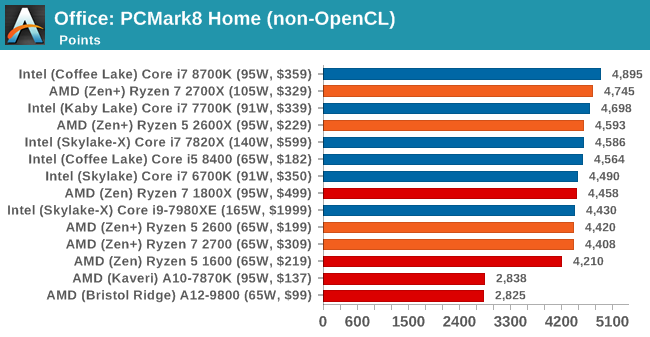
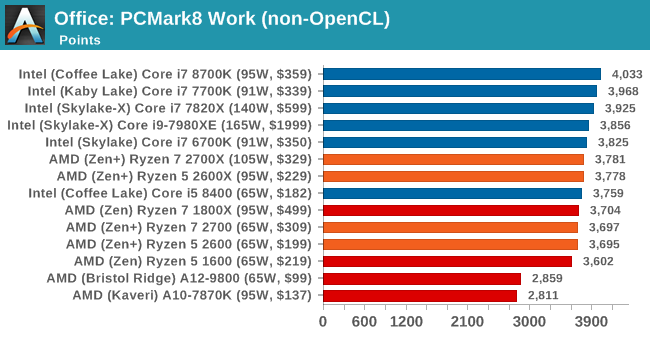
PCMark8: link
Despite originally coming out in 2008/2009, Futuremark has maintained PCMark8 to remain relevant in 2017. On the scale of complicated tasks, PCMark focuses more on the low-to-mid range of professional workloads, making it a good indicator for what people consider 'office' work. We run the benchmark from the commandline in 'conventional' mode, meaning C++ over OpenCL, to remove the graphics card from the equation and focus purely on the CPU. PCMark8 offers Home, Work and Creative workloads, with some software tests shared and others unique to each benchmark set.
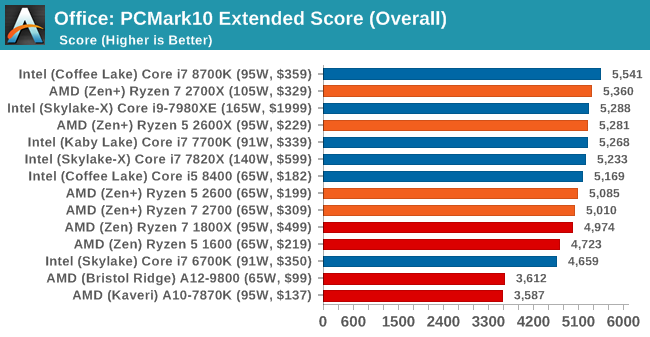
PCMark 10
GeekBench4
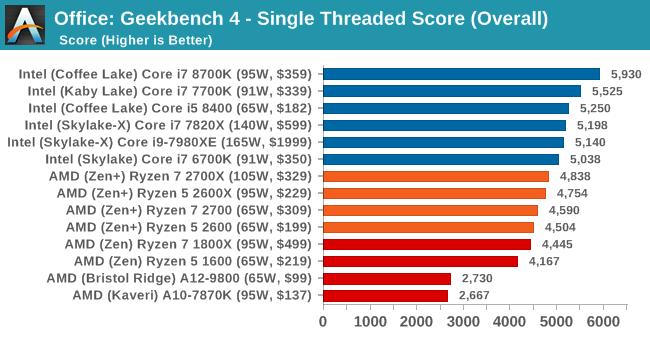
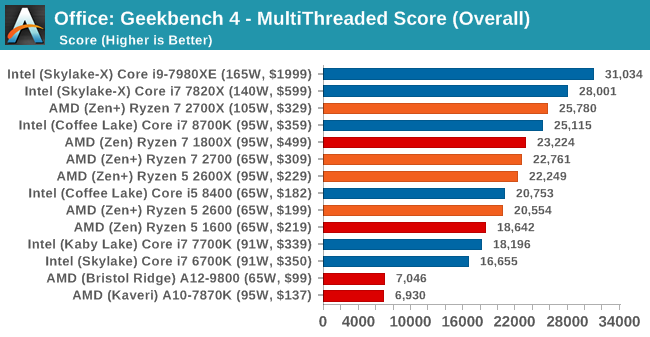
If you live and breathe GeekBench 4, then the single threaded results put Intel firmly in first place. For the multi-threaded tests, the top Intel and AMD mainstream parts are going at it almost neck-and-neck, however it is clear that the previous generation quad-cores are falling behind.


545 Comments
View All Comments
bsp2020 - Thursday, April 19, 2018 - link
Was AMD's recently announced Spectre mitigation used in the testing? I'm sorry if it was mentioned in the article. Too long and still in the process of reading.I'm a big fan of AMD but want to make sure the comparison is apples to apples. BTW, does anyone have link to performance impact analysis of AMD's Spectre mitigation?
fallaha56 - Thursday, April 19, 2018 - link
Yep, X470 is microcode parchedThis article as it stands is Intel Fanboi stuff
fallaha56 - Thursday, April 19, 2018 - link
As in the Toms articleSaturnusDK - Thursday, April 19, 2018 - link
Maybe he didn't notice that the tests are at stock speeds?DCide - Friday, April 20, 2018 - link
I can't find any other site using a BIOS as recent as the 0508 version you used (on the ASUS Crosshair VII Hero). Most sites are using older versions. These days, BIOS updates surrounding processor launches make significant performance differences. We've seen this with every Intel and AMD CPU launch since the original Ryzen.Shaheen Misra - Sunday, April 22, 2018 - link
Hi , im looking to gain some insight into your testing methods. Could you please explain why you test at such high graphics settings? Im sure you have previously stated the reasons but i am not familiar with them. My understanding has always been that this creates a graphics bottleneck?Targon - Monday, April 23, 2018 - link
When you consider that people want to see benchmark results how THEY would play the games or do work, it makes sense to focus on that sort of thing. Who plays at a 720p resolution? Yes, it may show CPU performance, or eliminate the GPU being the limiting factor, but if you have a Geforce 1080 GTX, 1080p, 1440, and then 4k performance is what people will actually game at.The ability to actually run video cards at or near their ability is also important, which can be a platform issue. If you see every CPU showing the same numbers with the same video card, then yea, it makes sense to go for the lower settings/resolutions, but since there ARE differences between the processors, running these tests the way they are makes more sense from a "these are similar to what people will see in the real world" perspective.
FlashYoshi - Thursday, April 19, 2018 - link
Intel CPUs were tested with Meltdown/Spectre patches, that's probably the discrepancy you're seeing.MuhOo - Thursday, April 19, 2018 - link
Computerbase and pcgameshardware also used the patched... every other site has completely different results from anandtechsor - Thursday, April 19, 2018 - link
Fwiw I took five minutes to see what you guys are talking about. To me it looks like Toms is screwed up. If you look at the time graphs it looks to me like it’s the purple line on top most of the time, but the summaries have that CPU in 3rd or 4th place. E.G. https://img.purch.com/r/711x457/aHR0cDovL21lZGlhLm...At any rate things are generally damn close, and they largely aren’t even benchmarking the same games, so I don’t understand why a few people are complaining.