The AMD 2nd Gen Ryzen Deep Dive: The 2700X, 2700, 2600X, and 2600 Tested
by Ian Cutress on April 19, 2018 9:00 AM ESTTranslating to IPC: All This for 3%?
Contrary to popular belief, increasing IPC is difficult. Attempt to ensure that each execution port is fed every cycle requires having wide decoders, large out-of-order queues, fast caches, and the right execution port configuration. It might sound easy to pile it all on, however both physics and economics get in the way: the chip still has to be thermally efficient and it has to make money for the company. Every generational design update will go for what is called the ‘low-hanging fruit’: the identified changes that give the most gain for the smallest effort. Usually reducing cache latency is not always the easiest task, and for non-semiconductor engineers (myself included), it sounds like a lot of work for a small gain.
For our IPC testing, we use the following rules. Each CPU is allocated four cores, without extra threading, and power modes are disabled such that the cores run at a specific frequency only. The DRAM is set to what the processor supports, so in the case of the new CPUs, that is DDR4-2933, and the previous generation at DDR4-2666. I have recently seen threads which dispute if this is fair: this is an IPC test, not an instruction efficiency test. The DRAM official support is part of the hardware specifications, just as much as the size of the caches or the number of execution ports. Running the two CPUs at the same DRAM frequency gives an unfair advantage to one of them: either a bigger overclock/underclock, and deviates from the intended design.
So in our test, we take the new Ryzen 7 2700X, the first generation Ryzen 7 1800X, and the pre-Zen Bristol Ridge based A12-9800, which is based on the AM4 platform and uses DDR4. We set each processors at four cores, no multi-threading, and 3.0 GHz, then ran through some of our tests.
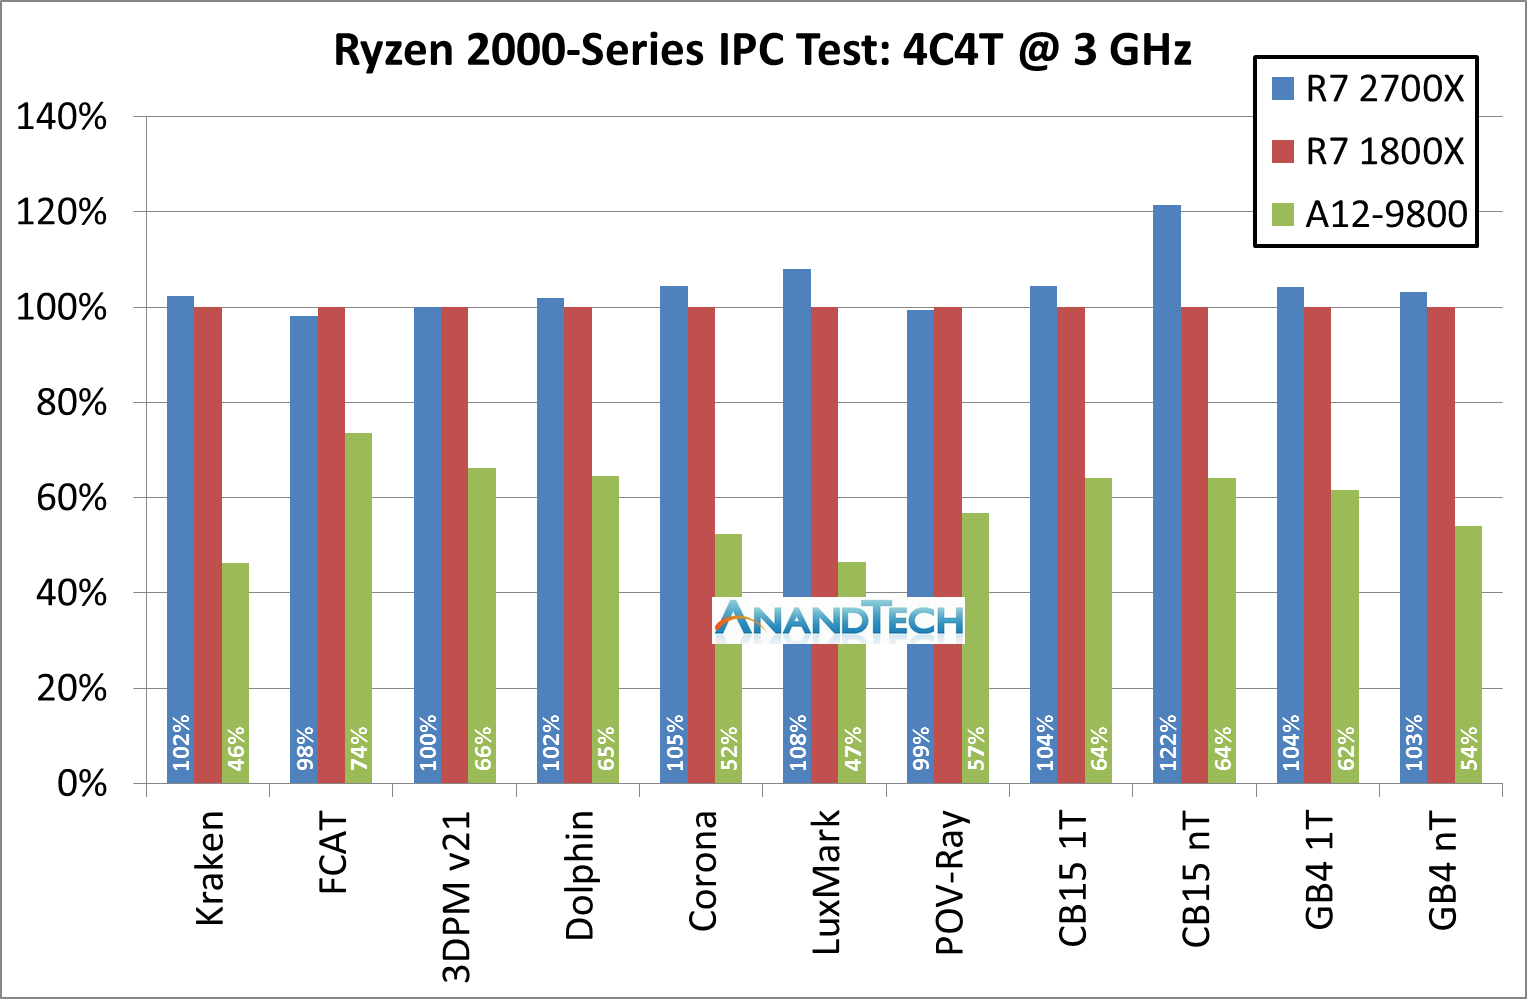
For this graph we have rooted the first generation Ryzen 7 1800X as our 100% marker, with the blue columns as the Ryzen 7 2700X. The problem with trying to identify a 3% IPC increase is that 3% could easily fall within the noise of a benchmark run: if the cache is not fully set before the run, it could encounter different performance. Shown above, a good number of tests fall in that +/- 2% range.
However, for compute heavy tasks, there are 3-4% benefits: Corona, LuxMark, CineBench and GeekBench are the ones here. We haven’t included the GeekBench sub-test results in the graph above, but most of those fall into the 2-5% category for gains.
If we take out Cinebench R15 nT result and the Geekbench memory tests, the average of all of the tests comes out to a +3.1% gain for the new Ryzen 2700X. That sounds bang on the money for what AMD stated it would do.
Cycling back to that Cinebench R15 nT result that showed a 22% gain. We also had some other IPC testing done at 3.0 GHz but with 8C/16T (which we couldn’t compare to Bristol Ridge), and a few other tests also showed 20%+ gains. This is probably a sign that AMD might have also adjusted how it manages its simultaneous multi-threading. This requires further testing.
AMD’s Overall 10% Increase
With some of the benefits of the 12LP manufacturing process, a few editors internally have questioned exactly why AMD hasn’t redesigned certain elements of the microarchitecture to take advantage. Ultimately it would appear that the ‘free’ frequency boost is worth just putting the same design in – as mentioned previously, the 12LP design is based on 14LPP with performance bump improvements. In the past it might not have been mentioned as a separate product line. So pushing through the same design is an easy win, allowing the teams to focus on the next major core redesign.
That all being said, AMD has previously already stated its intentions for the Zen+ core design – rolling back to CES at the beginning of the year, AMD stated that they wanted Zen+ and future products to go above and beyond the ‘industry standard’ of a 7-8% performance gain each year.
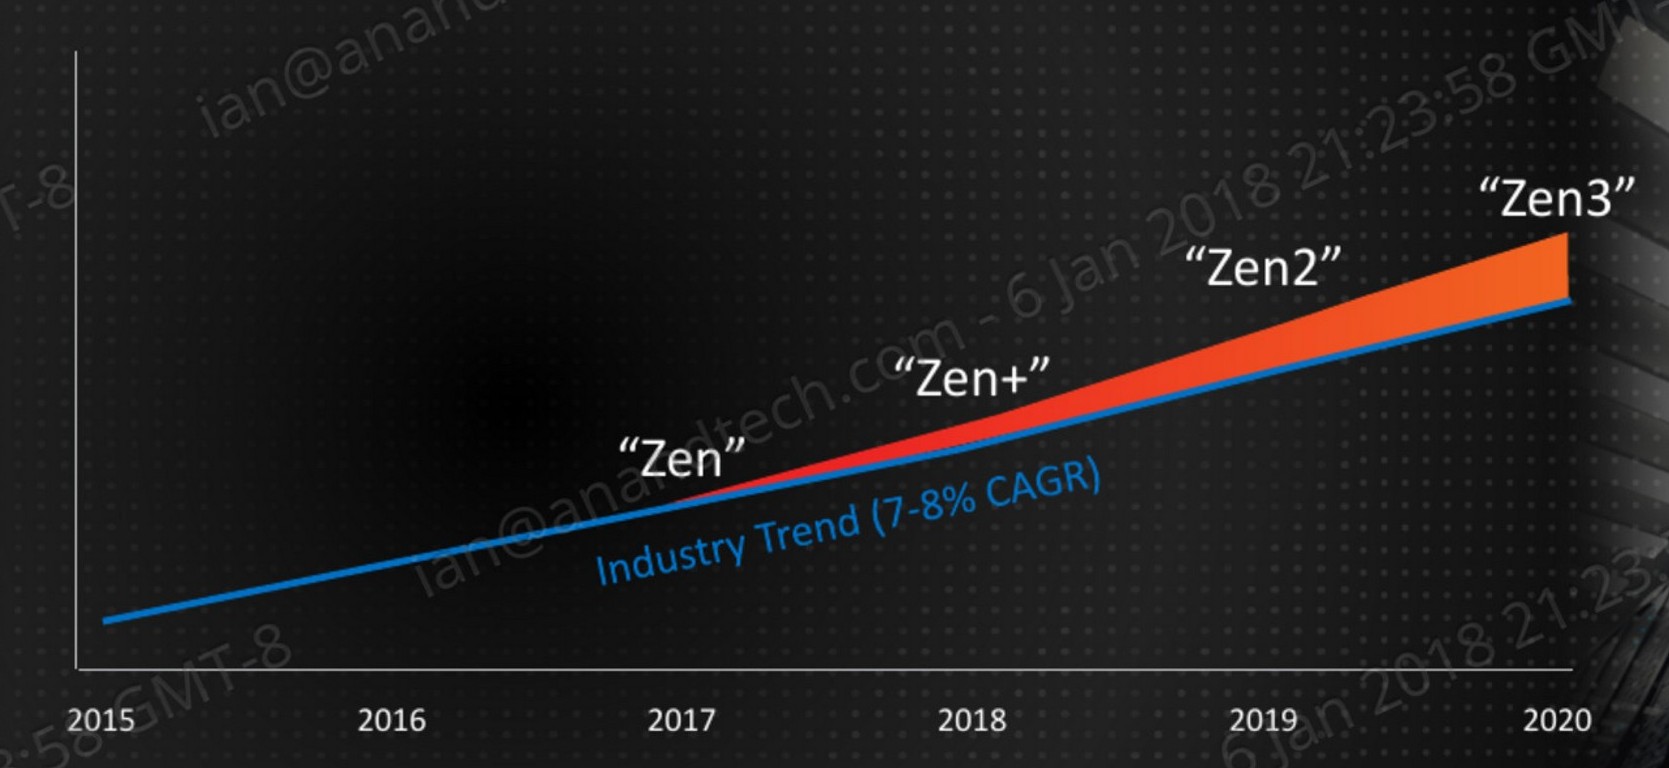
Clearly 3% IPC is not enough, so AMD is combining the performance gain with the +250 MHz increase, which is about another 6% peak frequency, with better turbo performance with Precision Boost 2 / XFR 2. This is about 10%, on paper at least. Benchmarks to follow.


545 Comments
View All Comments
prateekprakash - Friday, August 3, 2018 - link
"We’ll cover these in the next few pages, as well as the results from our testing.Overclocking"
Where is the overclocking result?
kithylin - Tuesday, September 4, 2018 - link
YET ANOTHER REVIEW THAT DOESN'T SHOW US THERMALS! HOW HARD IS IT TO SHOW US HOW HOT A CHIP RUNS ON AIR COOLING FFS, NO ONE SHOWS THERMALS ON THESE DAN CHIPS, THIS IS THE 20'TH REVIEW IN GOOGLE AND NO THERMALS!JRW - Thursday, December 6, 2018 - link
Last year I upgraded from a 1st gen i7 920 to i7 8700K and even with spectre & meltdown performance has been amazing, also Asus has been recently updating the motherboard BIOS with further CPU performance improvements.eyorngpbwcze - Monday, August 24, 2020 - link
http://bitly.com/zoom-viber-skype-psyzbbyykdivmfc - Friday, August 28, 2020 - link
50149 44831 16021 47938http://bitly.com/1ntFjX
89463 72869 99217 18464
http://bitly.com/1ntFjX - Вратарь Галактики смотреть онлайн 23419 47810 14568 17111