The AMD 2nd Gen Ryzen Deep Dive: The 2700X, 2700, 2600X, and 2600 Tested
by Ian Cutress on April 19, 2018 9:00 AM ESTCPU Encoding Tests
One of the interesting elements on modern processors is encoding performance. This includes encryption/decryption, as well as video transcoding from one video format to another. In the encrypt/decrypt scenario, this remains pertinent to on-the-fly encryption of sensitive data - a process by which more modern devices are leaning to for software security. Video transcoding as a tool to adjust the quality, file size and resolution of a video file has boomed in recent years, such as providing the optimum video for devices before consumption, or for game streamers who are wanting to upload the output from their video camera in real-time. As we move into live 3D video, this task will only get more strenuous, and it turns out that the performance of certain algorithms is a function of the input/output of the content.
All of our benchmark results can also be found in our benchmark engine, Bench.
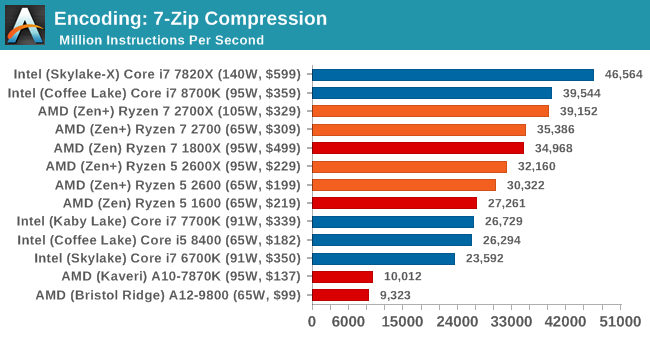
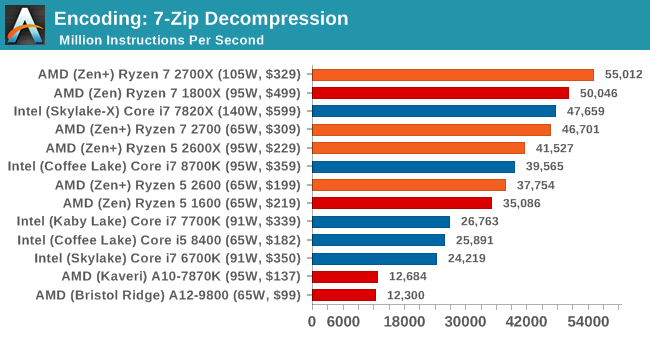
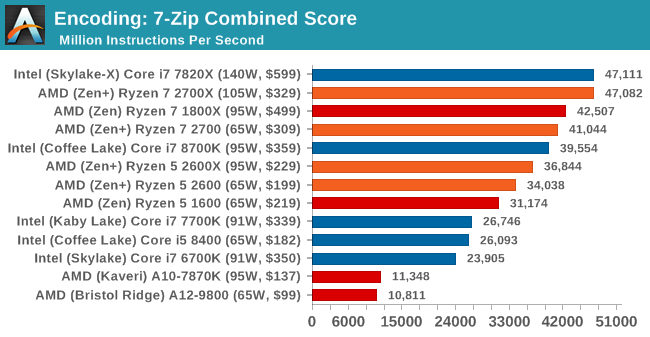
7-Zip 9.2: link
One of the freeware compression tools that offers good scaling performance between processors is 7-Zip. It runs under an open-source licence, is fast, and easy to use tool for power users. We run the benchmark mode via the command line for four loops and take the output score.
WinRAR 5.40: link
For the 2017 test suite, we move to the latest version of WinRAR in our compression test. WinRAR in some quarters is more user friendly that 7-Zip, hence its inclusion. Rather than use a benchmark mode as we did with 7-Zip, here we take a set of files representative of a generic stack (33 video files in 1.37 GB, 2834 smaller website files in 370 folders in 150 MB) of compressible and incompressible formats. The results shown are the time taken to encode the file. Due to DRAM caching, we run the test 10 times and take the average of the last five runs when the benchmark is in a steady state.
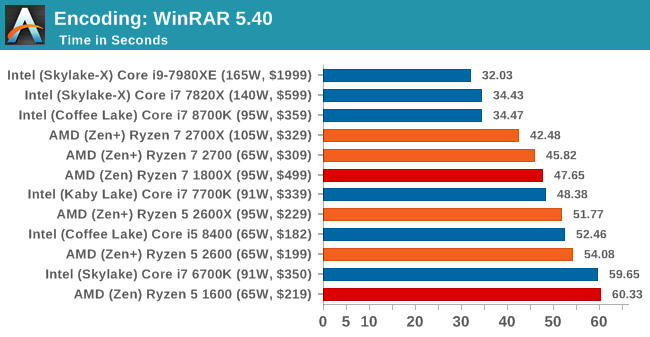
WinRAR requires a good memory base, so we see the quad-channel processors heading up the pack. The high IPC of the Core i7-8700K also does well.
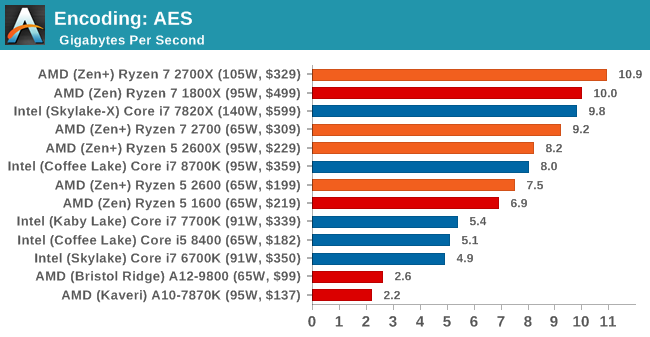
AES Encoding
Algorithms using AES coding have spread far and wide as a ubiquitous tool for encryption. Again, this is another CPU limited test, and modern CPUs have special AES pathways to accelerate their performance. We often see scaling in both frequency and cores with this benchmark. We use the latest version of TrueCrypt and run its benchmark mode over 1GB of in-DRAM data. Results shown are the GB/s average of encryption and decryption.
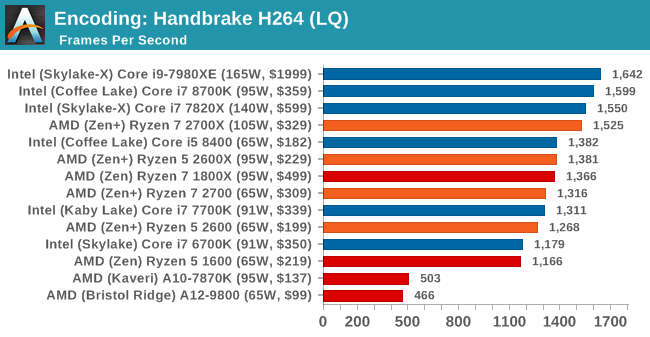
HandBrake v1.0.2 H264 and HEVC: link
As mentioned above, video transcoding (both encode and decode) is a hot topic in performance metrics as more and more content is being created. First consideration is the standard in which the video is encoded, which can be lossless or lossy, trade performance for file-size, trade quality for file-size, or all of the above can increase encoding rates to help accelerate decoding rates. Alongside Google's favorite codec, VP9, there are two others that are taking hold: H264, the older codec, is practically everywhere and is designed to be optimized for 1080p video, and HEVC (or H265) that is aimed to provide the same quality as H264 but at a lower file-size (or better quality for the same size). HEVC is important as 4K is streamed over the air, meaning less bits need to be transferred for the same quality content.
Handbrake is a favored tool for transcoding, and so our test regime takes care of three areas.
Low Quality/Resolution H264: Here we transcode a 640x266 H264 rip of a 2 hour film, and change the encoding from Main profile to High profile, using the very-fast preset.
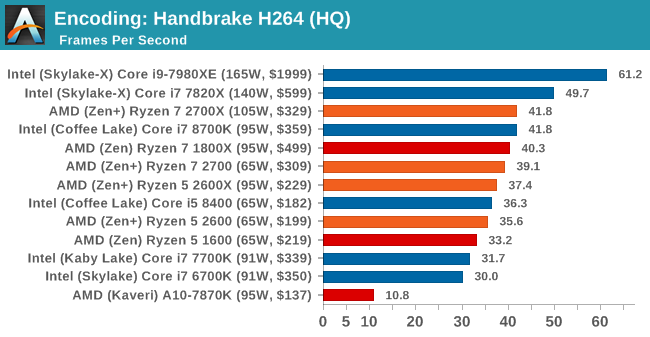
High Quality/Resolution H264: A similar test, but this time we take a ten-minute double 4K (3840x4320) file running at 60 Hz and transcode from Main to High, using the very-fast preset.
HEVC Test: Using the same video in HQ, we change the resolution and codec of the original video from 4K60 in H264 into 4K60 HEVC.
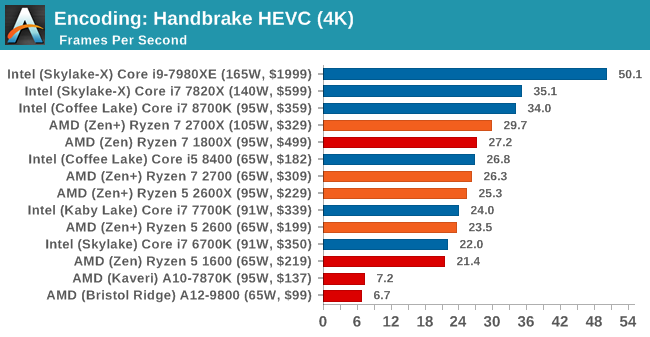
For HandBrake video encoding of large frames, there is a bump with the new Ryzen-2000 series processors over the previous generation, however there is still a gap up to the Core i7-8700K. The Core i5-8400 puts in a good showing here, above all but the best Ryzen parts.


545 Comments
View All Comments
Flying Aardvark - Monday, April 23, 2018 - link
There's usually a lag from 6-12 months on any change that's already in place. Any topic really. Humans aren't very good at seeing what's in front of them. It requires enough people repeating it over and over around them, until they accept reality.Before that reassurance from society around them, they don't have the confidence to see/admit reality. Just something I've noticed. :)
mapesdhs - Monday, May 14, 2018 - link
That's why I like Goodkind's "1st Rule": people will believe a lie either because they want to believe it's true, or they're afraid it's true.Kaihekoa - Tuesday, April 24, 2018 - link
I don't know what reviews you read, but the WCCF review shows slight favor to 8700K in gaming. However, it's an incomplete review of gaming as they only test at 1440p Ultra, where the GPU bears most of the workload, and only show average framerate. Tech Report doesn't even go into any detail whatsoever on gaming and only broaches the topic in a couple paragraphs on the conclusion page. Still, they even show a lead to Intel. Anandtech shows the 2700X leading every game in framerate, which is flat out inaccurate when compared to other reviews.The Spectre BS has marginal, if any, impact on game performance. I don't know how you get the idea that CPU IO is related to loading textures in a game when textures are loaded into VRAM by the GPU. Looking further into the test setup, Anand uses slower RAM on Intel platforms, an ECC mobo for Z170, doesn't disclose GPU driver versions and uses an enterprise OS on consumer hardware. I'm guessing these and/or other factors contributed to the inaccurate numbers, relative to other reviewers, causing me to lose a lot of respect for this once well-regarded hardware reviewer. I'll get my benchmark numbers from PC Perspective and Gamers Nexus instead.
Not hating on AMD, and I even own stock in both AMD and Intel. They offer tremendous value at their price points, but I spend alot of money on my PC and use it for gaming, overclocking/benching, and basic tasks, which all seem better suited to Intel's IPC/clock speed advantage. I need reviews to post accurate numbers so that I can make my upgrade decisions, and this incomplete review with numbers not reflective of actual gaming performance fails to meet that need.
Flying Aardvark - Tuesday, April 24, 2018 - link
Come on man. I almost stop responding to replies like this. WCCF benches the base 2700, of course the 8700K wins, they don't include the 2700X. Again, the results line up with AT's. I wrote TR but meant TechRadar.Eh, I'm not going to keep going on addressing all these "points". IO is a syscall, reading/writing to disk is a syscall and that's where Intel takes up to a 50% perf hit with their Spectre v3 patches in place. This is known, and been known for months on the impact for games that do lots of texture steaming like ROTR. I even provided user provided evidence, that beat Anandtech here to the punch by 3 months.
Anand used Intel/AMD memory spec. That's what you're supposed to do when testing a product advertised to use certain components (for good reason, BTW, stupid gamer kids discounted).
Bottom line is that you and people flipping out just like you are wrong. I already knew about this being under the surface months ago. Now that it's impossible to cover it up with the 2000 series launch, more people are simply aware that AMD has taken over.
GreenMeters - Tuesday, April 24, 2018 - link
But Anandtech has the 2700, and even the 2600X and 2600, beating the 8700K. So how are the WCCF benchmarks lining up with Anandtech's?Maxiking - Tuesday, April 24, 2018 - link
"I just finished running Rise of the Tomb Raider benchmarks, 1080p, very high preset, FXAA.Unpatched:
Mountain Peak: 131.48 FPS (min: 81.19 max: 197.02)
Syria: 101.99 FPS (min: 62.73, max: 122.24)
Geothermal Valley: 98.93 FPS (min:76.48, max: 117.00)
Overall score: 111.31 FPS
Windows patch only:
Mountain Peak: 135.34 FPS (min: 38.21 max: 212.84)
Syria: 102.54 FPS (min: 44.22, max: 144.03)
Geothermal Valley: 96.36 FPS (min:41.35, max: 148.46)
Overall score: 111.93 FPS
Windows patch and BIOS update:
Mountain Peak: 134.01 FPS (min: 59.91 max: 216.16)
Syria: 101.68 FPS (min: 38.95, max: 143.44)
Geothermal Valley: 97.55 FPS (min:46.18, max: 143.97)
Overall score: 111.62 FPS
Average framerates don't seem affected."
From the link you posted, you got rekt by yourself.
Maxiking - Tuesday, April 24, 2018 - link
Actually, I can't bother waiting because, it's futile.The benchmark from that thread shows there has been no noticable performance regression after the updates had been applied.
I know what you gonna do. Look at those min fps. I WAS RIGHT. I WAS RIGHT. You are thinking right now. No, you weren't. If you ever had run TOR benchmarks, you would have experienced it. There are quite severe discrepancies in the inbuilt benchmark when comes to min/max fps. I noticed it myself when I was overclocking 6700k and running game benchmarks, stability tests. Since you are mostly using anecdotal evidence, you do not know how to make proper arguments, don't provide valid sources, we are really limited here, but that's what we have.
To support my statement, here is the video:
https://www.youtube.com/watch?v=BZEhkcs9hpU
It is not mine, but it is proving my point, there is an issue in the benchmark. It shows wrong/misleading min/max fps pretty often which other benchmarking solutions doesn't record.
The video was published on 7 Jul 2016, so no meltdown/spectre for you. I know you will argue it is no coincidence with those min fps, but look at the max as well.
Maxiking - Tuesday, April 24, 2018 - link
*solutionFlying Aardvark - Wednesday, April 25, 2018 - link
Are you retarded? I know you are because I ran those benchmarks myself and it's reproducible on more games than ROTR. Where's your contradicting information to back your claim, you do know that trying to poke holes in info is not an argument.Ranger1065 - Wednesday, April 25, 2018 - link
So sad the review failed to meet your expectations. Enjoy your time at Gamer's Nexus (cough).