The AMD 2nd Gen Ryzen Deep Dive: The 2700X, 2700, 2600X, and 2600 Tested
by Ian Cutress on April 19, 2018 9:00 AM ESTRise of the Tomb Raider
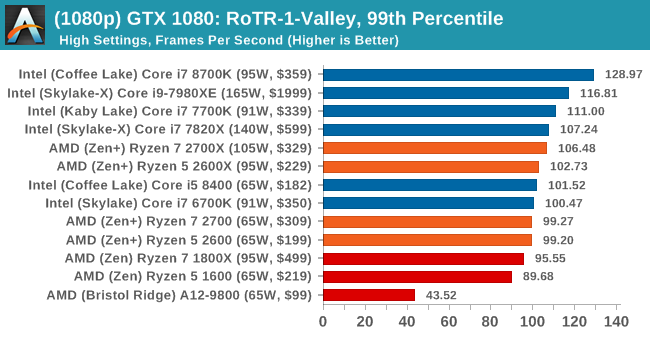
One of the newest games in the gaming benchmark suite is Rise of the Tomb Raider (RoTR), developed by Crystal Dynamics, and the sequel to the popular Tomb Raider which was loved for its automated benchmark mode. But don’t let that fool you: the benchmark mode in RoTR is very much different this time around.
Visually, the previous Tomb Raider pushed realism to the limits with features such as TressFX, and the new RoTR goes one stage further when it comes to graphics fidelity. This leads to an interesting set of requirements in hardware: some sections of the game are typically GPU limited, whereas others with a lot of long-range physics can be CPU limited, depending on how the driver can translate the DirectX 12 workload.
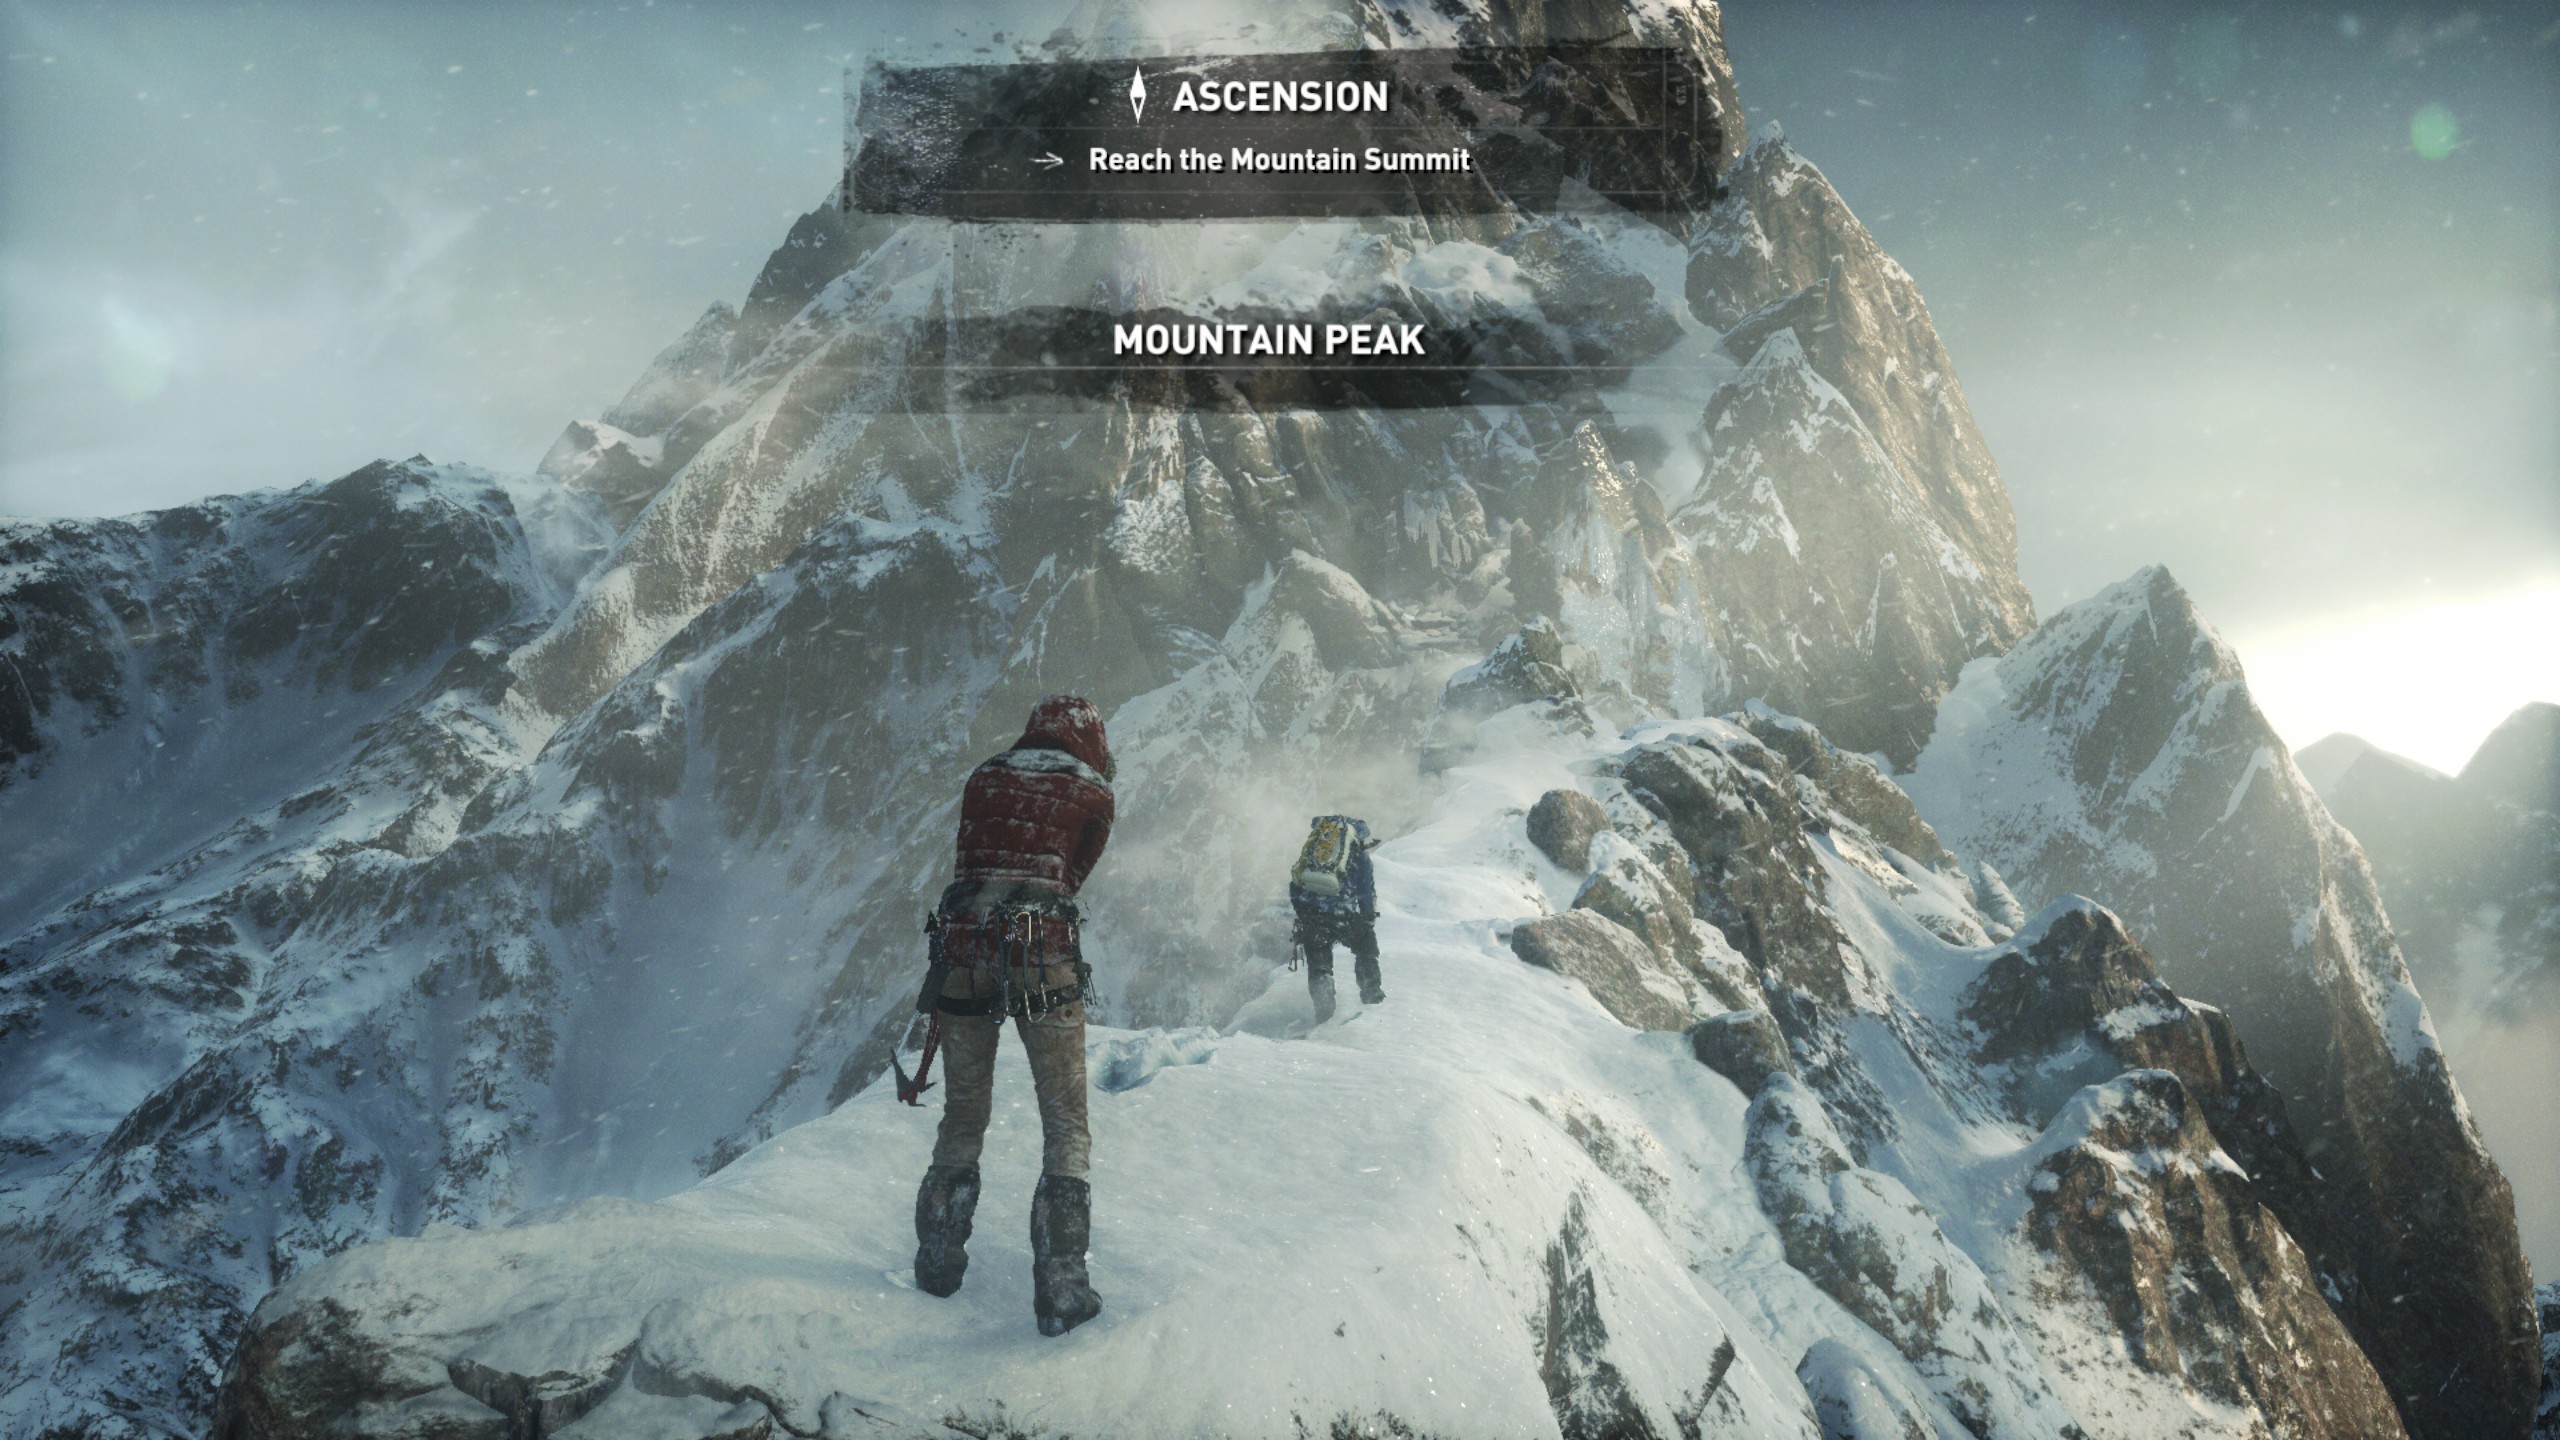
Where the old game had one benchmark scene, the new game has three different scenes with different requirements: Geothermal Valley (1-Valley), Prophet’s Tomb (2-Prophet) and Spine of the Mountain (3-Mountain) - and we test all three. These are three scenes designed to be taken from the game, but it has been noted that scenes like 2-Prophet shown in the benchmark can be the most CPU limited elements of that entire level, and the scene shown is only a small portion of that level. Because of this, we report the results for each scene on each graphics card separately.
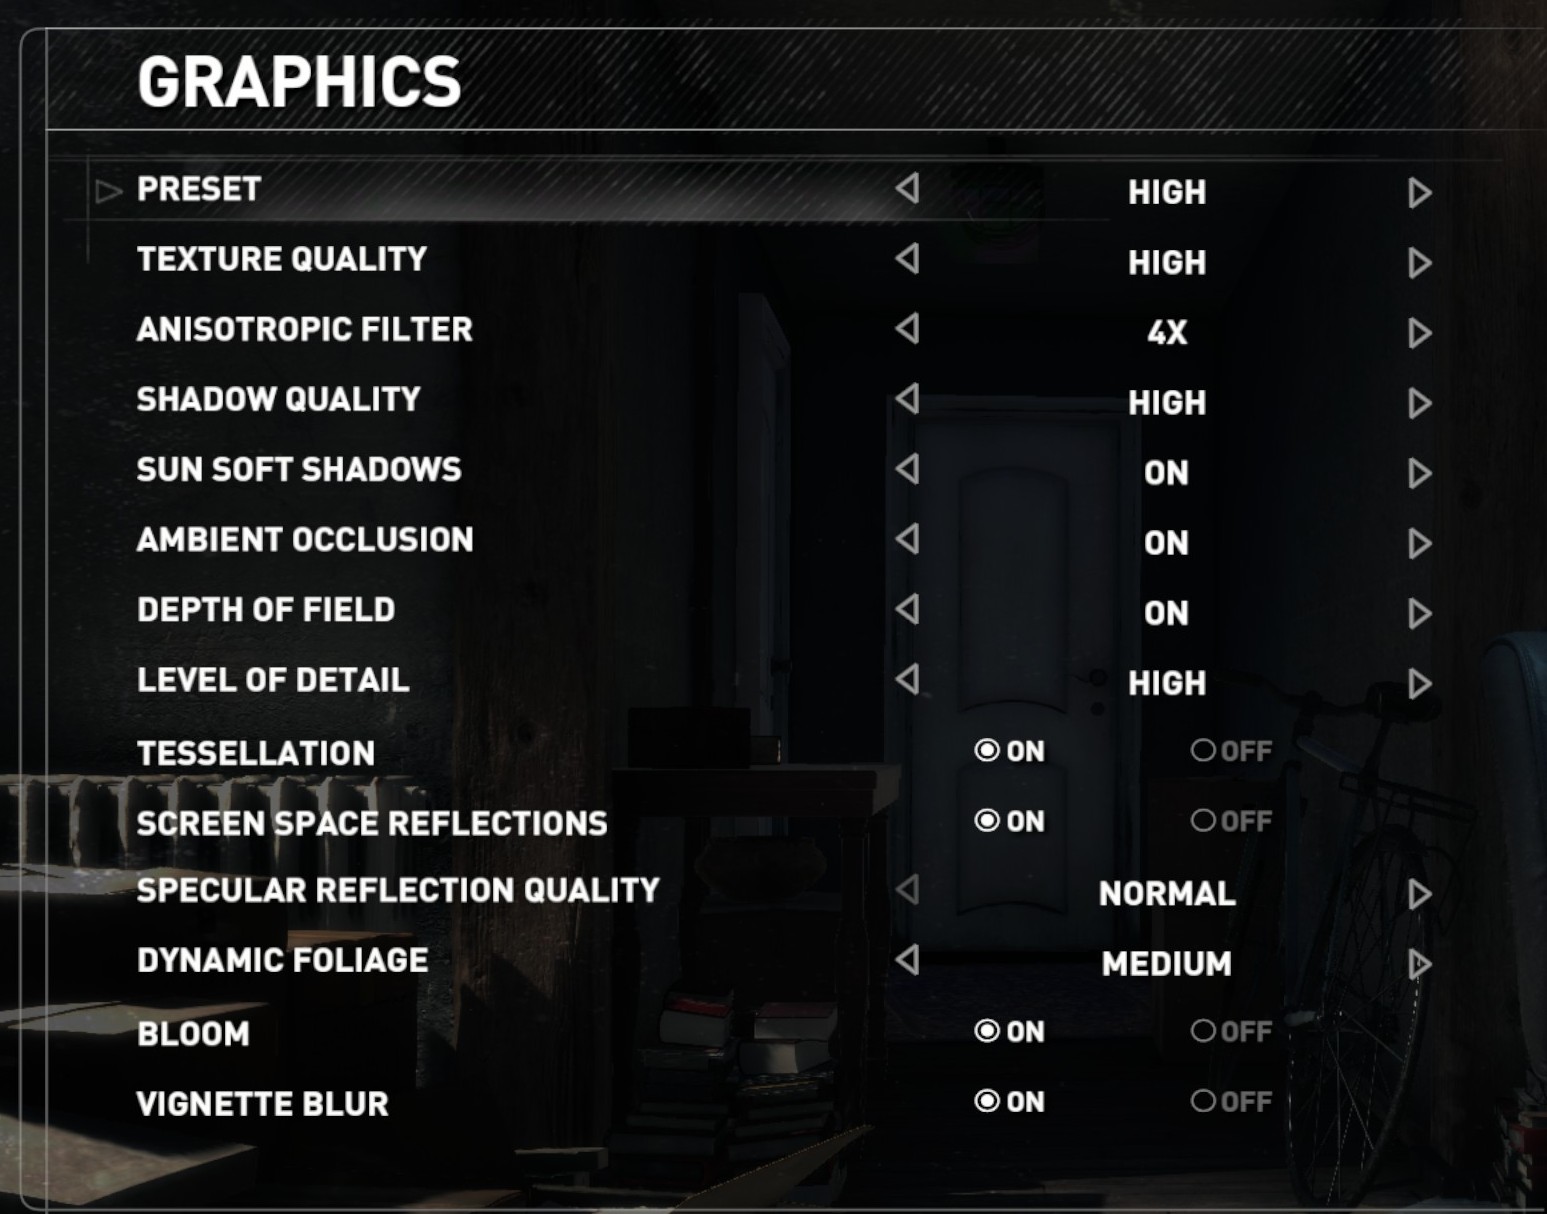
Graphics options for RoTR are similar to other games in this type, offering some presets or allowing the user to configure texture quality, anisotropic filter levels, shadow quality, soft shadows, occlusion, depth of field, tessellation, reflections, foliage, bloom, and features like PureHair which updates on TressFX in the previous game.
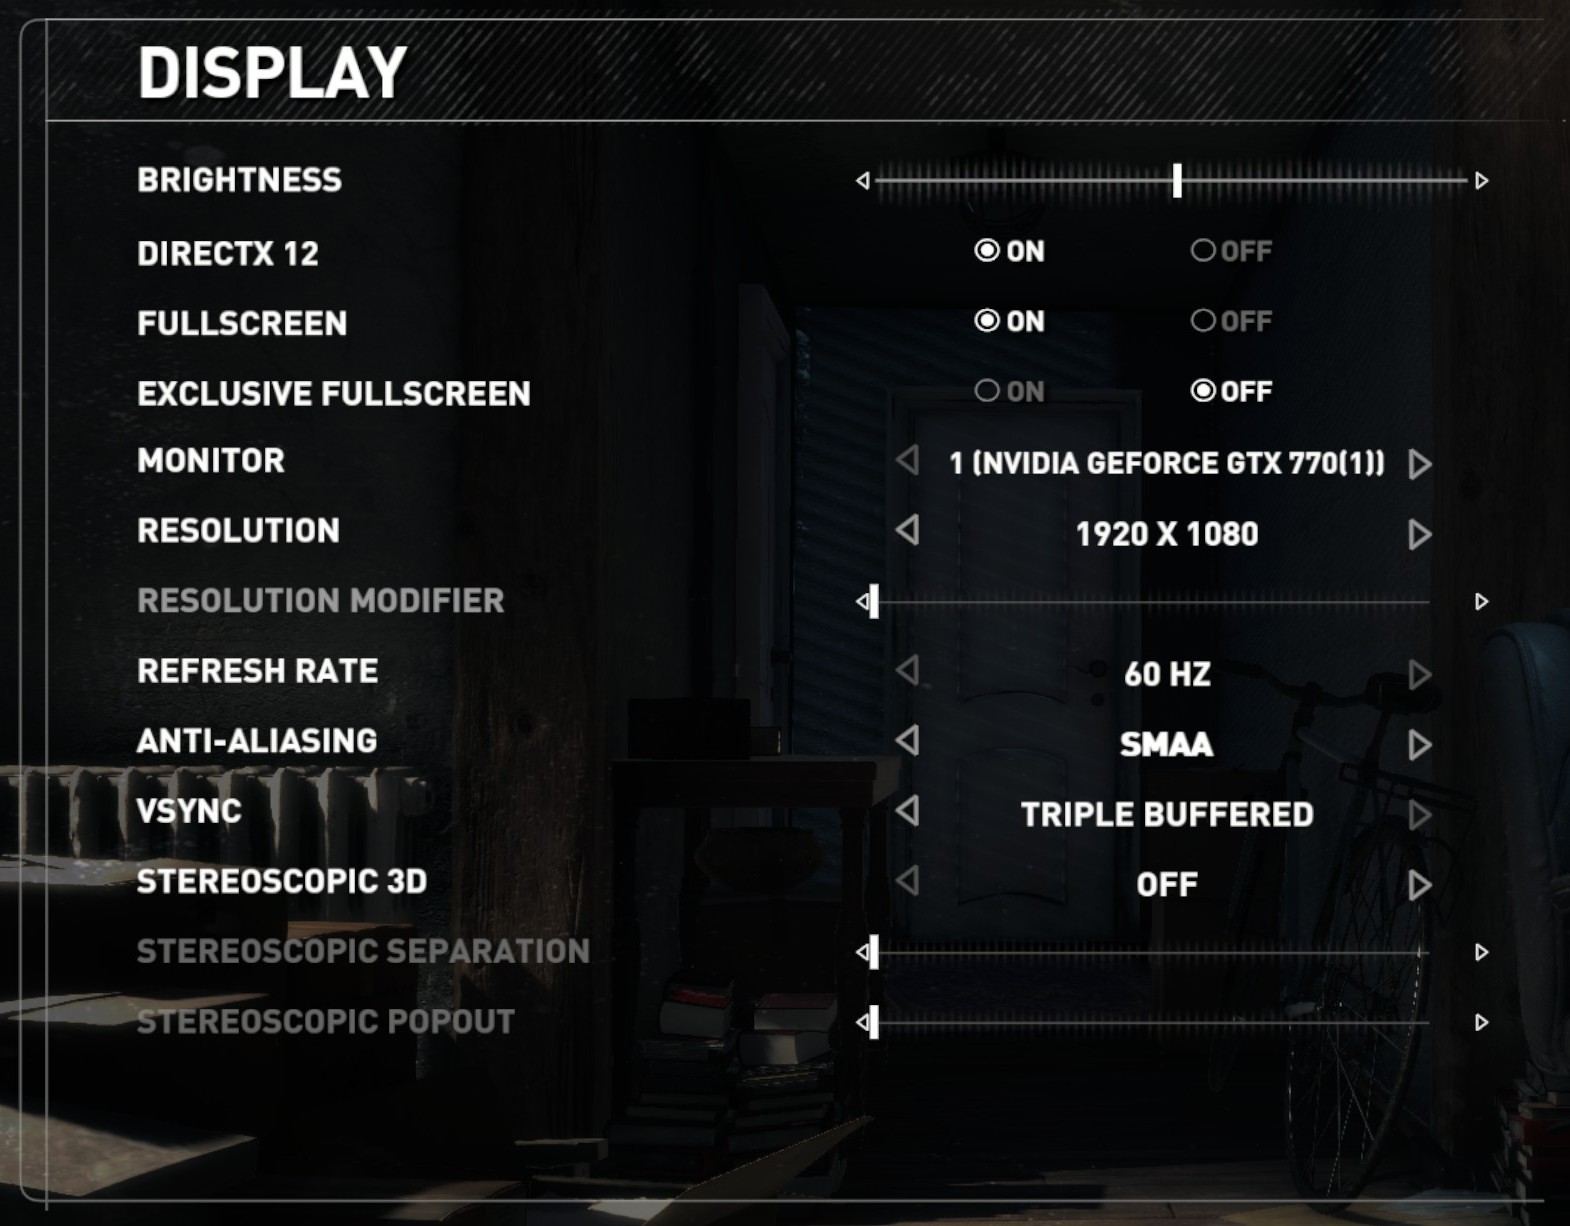
Again, we test at 1920x1080 and 4K using our native 4K displays. At 1080p we run the High preset, while at 4K we use the Medium preset which still takes a sizable hit in frame rate.
It is worth noting that RoTR is a little different to our other benchmarks in that it keeps its graphics settings in the registry rather than a standard ini file, and unlike the previous TR game the benchmark cannot be called from the command-line. Nonetheless we scripted around these issues to automate the benchmark four times and parse the results. From the frame time data, we report the averages, 99th percentiles, and our time under analysis.
All of our benchmark results can also be found in our benchmark engine, Bench.
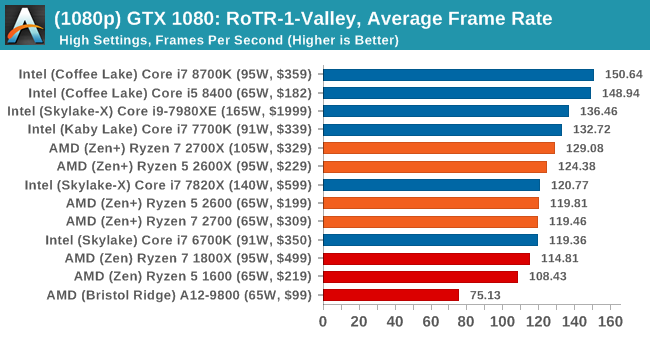
1080p

4K


545 Comments
View All Comments
techguymaxc - Thursday, April 19, 2018 - link
Either you don't have a fast enough GPU to remove the GPU bottleneck or there's something wrong with your data because there is NO chance Ryzen is faster than *lake in GTA V, with lower IPC and clocks.Don't get me wrong, Ryzen 2 looks like a good product family and I wouldn't discourage anyone from buying.
SaturnusDK - Thursday, April 19, 2018 - link
As everyone else that are misreading the results. Tests are done at stock speeds and no overclocking.LurkingSince97 - Thursday, April 19, 2018 - link
Yes there is.Stock CPU and RAM speeds. Fully spectre / meltdown patched on both sides. Who is re-using old results? This review re-uses old results for the older generation Ryzen, and so some of the performance boost could be false (new drivers, OS patches, firmware, bios....).
More investigation is needed on all sides. Many other review sites are significantly more lazy than AT and are likely recycling old results for the Intel side.
As for your GPU bottleneck.... um no. Look at the results, as the resolution goes up, THEN you get GPU bottlenecked and all CPUs look the same. At low resolutions, it is clearly not GPU bottlenecked as there is a big FPS difference by CPU.
jaydee - Thursday, April 19, 2018 - link
Great review. Curious to see how things scale down for a 35W TDP part compared to Intel's latest 35W TDP CPUs.SaturnusDK - Thursday, April 19, 2018 - link
Gamers Nexus have tested the 2700X to work at 1.175V locked to 4.1GHz where it consumes 129W compared to stock frequency and stock voltage where it consumes 200W. Performance is generally the same on average.Flunk - Thursday, April 19, 2018 - link
Wow, that single-thread performance delta sure has shrunk hasn't it? Between meltdown and higher core clocks on the Zen+.mapesdhs - Saturday, April 21, 2018 - link
Wonder whether it won't be that much longer until AMD launches something which actually beats Intel in IPC. Atm, people keep saying Intel wins on IPC, but it's only because Intel has punched its clock rates through the roof (it's like the old P4 days again), something they could have done years ago but never bothered because there was no competition, just as they could have released a consumer 8-core long ago but didn't (the 3930K was a crippled 8-core, but back then AMD couldn't even beat mainstream SB, never mind SB-E).mkaibear - Monday, April 23, 2018 - link
You know IPC is "instructions per clock", yeah? So saying Intel wins on IPC because their clock rate is faster doesn't make sense, it's like saying UK cars have a higher mpg then US cars because their gallons are bigger.Intel wins (won?) on IPC because they executed more instructions per MHz of the clock rate. When you couple that with a faster clock rate you get a double whammy of performance. It does appear that AMD has almost closed the door on IPC but is still not operating on as high a clock rate.
Targon - Monday, April 23, 2018 - link
This is why many are looking forward to Zen 2 in 2019, which will have true design improvements compared to Zen and Zen+. Zen+ is a small and incremental improvement over Zen(first generation Ryzen chips). Combined with 7nm, we may very well see AMD get very close to Intel clock speeds while having very similar, if not better IPC and a higher core count.MajGenRelativity - Thursday, April 19, 2018 - link
Looks like a good review. Glad to see AMD closing the performance gap even further!