The AMD 2nd Gen Ryzen Deep Dive: The 2700X, 2700, 2600X, and 2600 Tested
by Ian Cutress on April 19, 2018 9:00 AM ESTCPU Legacy Tests
Our legacy tests represent benchmarks that were once at the height of their time. Some of these are industry standard synthetics, and we have data going back over 10 years. All of the data here has been rerun on Windows 10, and we plan to go back several generations of components to see how performance has evolved.
All of our benchmark results can also be found in our benchmark engine, Bench.
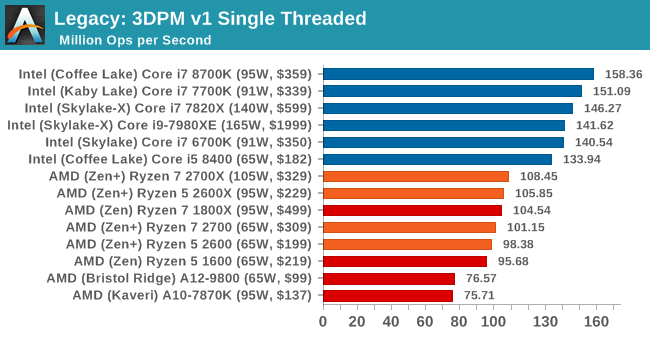
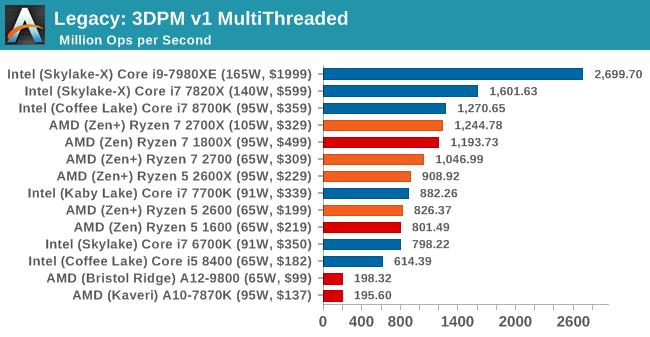
3D Particle Movement v1
3DPM is a self-penned benchmark, taking basic 3D movement algorithms used in Brownian Motion simulations and testing them for speed. High floating point performance, MHz and IPC wins in the single thread version, whereas the multithread version has to handle the threads and loves more cores. This is the original version, written in the style of a typical non-computer science student coding up an algorithm for their theoretical problem, and comes without any non-obvious optimizations not already performed by the compiler, such as false sharing.
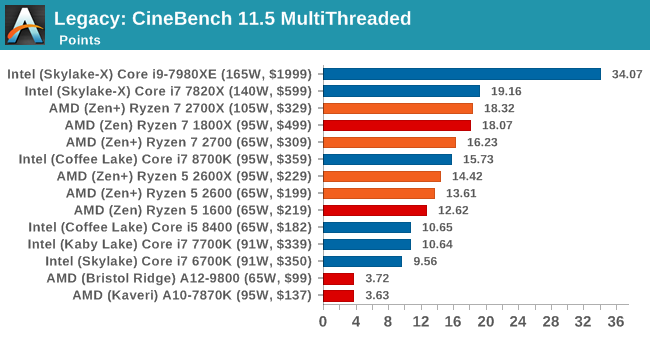
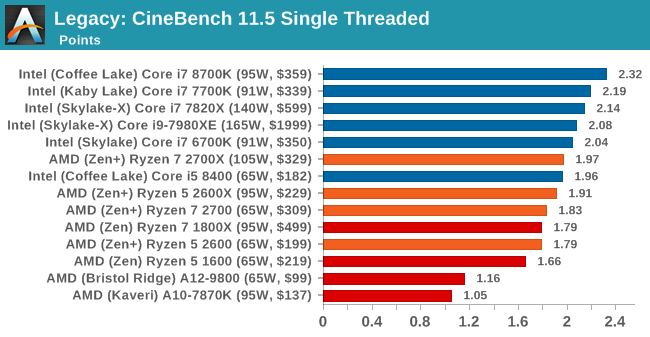
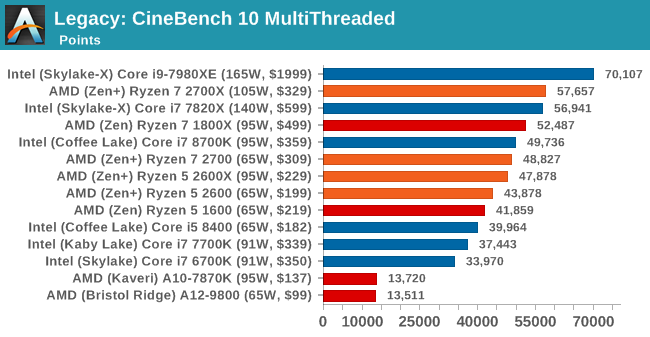
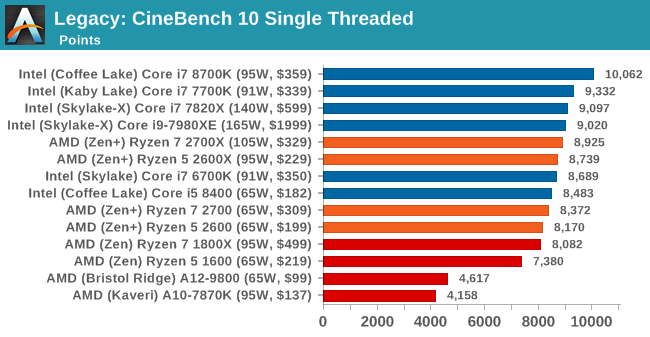
CineBench 11.5 and 10
Cinebench is a widely known benchmarking tool for measuring performance relative to MAXON's animation software Cinema 4D. Cinebench has been optimized over a decade and focuses on purely CPU horsepower, meaning if there is a discrepancy in pure throughput characteristics, Cinebench is likely to show that discrepancy. Arguably other software doesn't make use of all the tools available, so the real world relevance might purely be academic, but given our large database of data for Cinebench it seems difficult to ignore a small five minute test. We run the modern version 15 in this test, as well as the older 11.5 and 10 due to our back data.
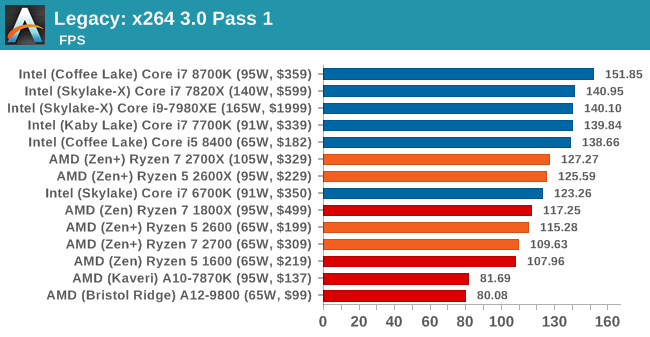
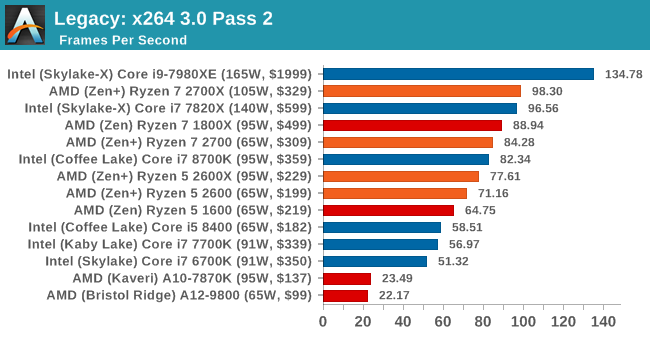
x264 HD 3.0
Similarly, the x264 HD 3.0 package we use here is also kept for historic regressional data. The latest version is 5.0.1, and encodes a 1080p video clip into a high quality x264 file. Version 3.0 only performs the same test on a 720p file, and in most circumstances the software performance hits its limit on high end processors, but still works well for mainstream and low-end. Also, this version only takes a few minutes, whereas the latest can take over 90 minutes to run.


545 Comments
View All Comments
techguymaxc - Thursday, April 19, 2018 - link
Either you don't have a fast enough GPU to remove the GPU bottleneck or there's something wrong with your data because there is NO chance Ryzen is faster than *lake in GTA V, with lower IPC and clocks.Don't get me wrong, Ryzen 2 looks like a good product family and I wouldn't discourage anyone from buying.
SaturnusDK - Thursday, April 19, 2018 - link
As everyone else that are misreading the results. Tests are done at stock speeds and no overclocking.LurkingSince97 - Thursday, April 19, 2018 - link
Yes there is.Stock CPU and RAM speeds. Fully spectre / meltdown patched on both sides. Who is re-using old results? This review re-uses old results for the older generation Ryzen, and so some of the performance boost could be false (new drivers, OS patches, firmware, bios....).
More investigation is needed on all sides. Many other review sites are significantly more lazy than AT and are likely recycling old results for the Intel side.
As for your GPU bottleneck.... um no. Look at the results, as the resolution goes up, THEN you get GPU bottlenecked and all CPUs look the same. At low resolutions, it is clearly not GPU bottlenecked as there is a big FPS difference by CPU.
jaydee - Thursday, April 19, 2018 - link
Great review. Curious to see how things scale down for a 35W TDP part compared to Intel's latest 35W TDP CPUs.SaturnusDK - Thursday, April 19, 2018 - link
Gamers Nexus have tested the 2700X to work at 1.175V locked to 4.1GHz where it consumes 129W compared to stock frequency and stock voltage where it consumes 200W. Performance is generally the same on average.Flunk - Thursday, April 19, 2018 - link
Wow, that single-thread performance delta sure has shrunk hasn't it? Between meltdown and higher core clocks on the Zen+.mapesdhs - Saturday, April 21, 2018 - link
Wonder whether it won't be that much longer until AMD launches something which actually beats Intel in IPC. Atm, people keep saying Intel wins on IPC, but it's only because Intel has punched its clock rates through the roof (it's like the old P4 days again), something they could have done years ago but never bothered because there was no competition, just as they could have released a consumer 8-core long ago but didn't (the 3930K was a crippled 8-core, but back then AMD couldn't even beat mainstream SB, never mind SB-E).mkaibear - Monday, April 23, 2018 - link
You know IPC is "instructions per clock", yeah? So saying Intel wins on IPC because their clock rate is faster doesn't make sense, it's like saying UK cars have a higher mpg then US cars because their gallons are bigger.Intel wins (won?) on IPC because they executed more instructions per MHz of the clock rate. When you couple that with a faster clock rate you get a double whammy of performance. It does appear that AMD has almost closed the door on IPC but is still not operating on as high a clock rate.
Targon - Monday, April 23, 2018 - link
This is why many are looking forward to Zen 2 in 2019, which will have true design improvements compared to Zen and Zen+. Zen+ is a small and incremental improvement over Zen(first generation Ryzen chips). Combined with 7nm, we may very well see AMD get very close to Intel clock speeds while having very similar, if not better IPC and a higher core count.MajGenRelativity - Thursday, April 19, 2018 - link
Looks like a good review. Glad to see AMD closing the performance gap even further!