Marrying Vega and Zen: The AMD Ryzen 5 2400G Review
by Ian Cutress on February 12, 2018 9:00 AM ESTBenchmarking Performance: CPU System Tests
Our first set of tests is our general system tests. These set of tests are meant to emulate more about what people usually do on a system, like opening large files or processing small stacks of data. This is a bit different to our office testing, which uses more industry standard benchmarks, and a few of the benchmarks here are relatively new and different.
All of our benchmark results can also be found in our benchmark engine, Bench.
PDF Opening
First up is a self-penned test using a monstrous PDF we once received in advance of attending an event. While the PDF was only a single page, it had so many high-quality layers embedded it was taking north of 15 seconds to open and to gain control on the mid-range notebook I was using at the time. This put it as a great candidate for our 'let's open an obnoxious PDF' test. Here we use Adobe Reader DC, and disable all the update functionality within. The benchmark sets the screen to 1080p, opens the PDF to in fit-to-screen mode, and measures the time from sending the command to open the PDF until it is fully displayed and the user can take control of the software again. The test is repeated ten times, and the average time taken. Results are in milliseconds.
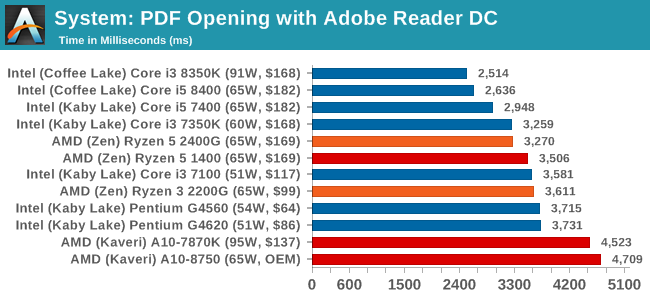
Our PDF test relies mostly on single core frequency, but memory frequency can also help. The 2400G pips the 1400, and the older AMD processors take a back seat. This is the sort of test that Intel's 4.2 GHz chips can take advantage off, as shown by the Core i3-8350K.
FCAT Processing: link
One of the more interesting workloads that has crossed our desks in recent quarters is FCAT - the tool we use to measure stuttering in gaming due to dropped or runt frames. The FCAT process requires enabling a color-based overlay onto a game, recording the gameplay, and then parsing the video file through the analysis software. The software is mostly single-threaded, however because the video is basically in a raw format, the file size is large and requires moving a lot of data around. For our test, we take a 90-second clip of the Rise of the Tomb Raider benchmark running on a GTX 980 Ti at 1440p, which comes in around 21 GB, and measure the time it takes to process through the visual analysis tool.
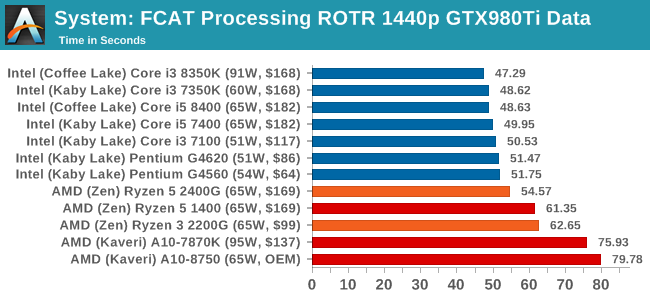
The FCAT program is single threaded, so again Intel's chips take a win here. The Ryzen 5 2400G takes another chunk out of the Ryzen 5 1400, due to its higher frequency.
Dolphin Benchmark: link
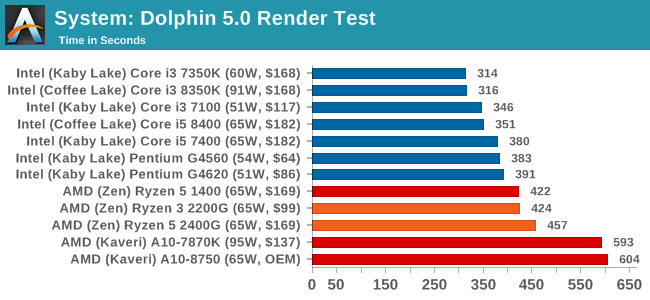
Many emulators are often bound by single thread CPU performance, and general reports tended to suggest that Haswell provided a significant boost to emulator performance. This benchmark runs a Wii program that ray traces a complex 3D scene inside the Dolphin Wii emulator. Performance on this benchmark is a good proxy of the speed of Dolphin CPU emulation, which is an intensive single core task using most aspects of a CPU. Results are given in seconds, where the Wii itself scores 1,052 seconds (17.53 minutes).
3D Movement Algorithm Test v2.1: link
This is the latest version of the self-penned 3DPM benchmark. The goal of 3DPM is to simulate semi-optimized scientific algorithms taken directly from my doctorate thesis. Version 2.1 improves over 2.0 by passing the main particle structs by reference rather than by value, and decreasing the amount of double->float->double recasts the compiler was adding in. It affords a ~25% speed-up over v2.0, which means new data.
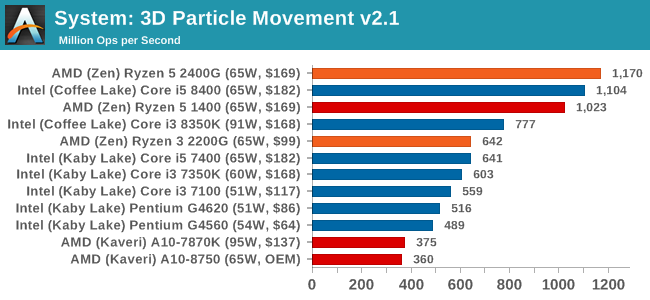
3DPM is our first multi-threaded test, and the Ryzen 5 2400G powers ahead over the 1400 due to frequency, and ahead the Core i3-8350K due to thread count. This is a benchmark that can take advantage of multithreading, so the quad-core APU with eight threads pushes ahead of the six-core Intel Core i5-8400.
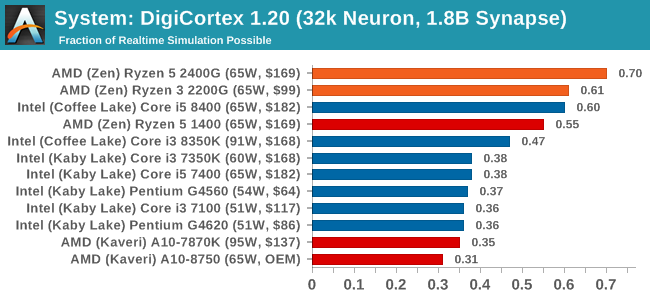
DigiCortex v1.20: link
Despite being a couple of years old, the DigiCortex software is a pet project for the visualization of neuron and synapse activity in the brain. The software comes with a variety of benchmark modes, and we take the small benchmark which runs a 32k neuron/1.8B synapse simulation. The results on the output are given as a fraction of whether the system can simulate in real-time, so anything above a value of one is suitable for real-time work. The benchmark offers a 'no firing synapse' mode, which in essence detects DRAM and bus speed, however we take the firing mode which adds CPU work with every firing.
Agisoft Photoscan 1.3.3: link
Photoscan stays in our benchmark suite from the previous version, however now we are running on Windows 10 so features such as Speed Shift on the latest processors come into play. The concept of Photoscan is translating many 2D images into a 3D model - so the more detailed the images, and the more you have, the better the model. The algorithm has four stages, some single threaded and some multi-threaded, along with some cache/memory dependency in there as well. For some of the more variable threaded workload, features such as Speed Shift and XFR will be able to take advantage of CPU stalls or downtime, giving sizeable speedups on newer microarchitectures.
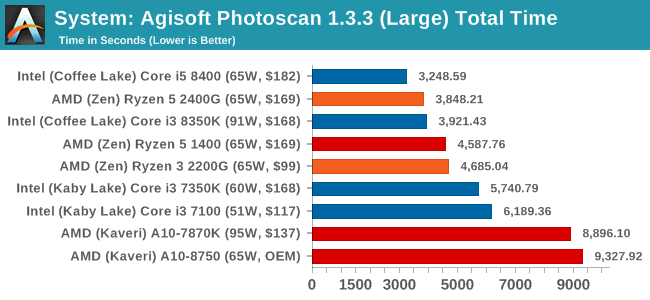
For Photoscan, certain elements of the algorithms require full cores to get the best performance, hence why the six-core CPU comes top and the Ryzen 5 2400G and Core i3-8350K are matched. That being said, the multithreading of the 2400G outweighs the extra frequency of the 8350K.


177 Comments
View All Comments
Cooe - Monday, February 12, 2018 - link
Here's an article with a bunch of graph's that include the i7-5775C if you'd prefer to peep this instead of that vid.https://hothardware.com/reviews/amd-raven-ridge-ry...
Cooe - Monday, February 12, 2018 - link
Your i7-5775C isn't even as fast as an old Kavari A10 w/ 512 GCN2 SP's (it's close, but no cigar), so vs Vega 8 & 11 it gets it's ass absolutely handed to it... like by a lot - https://youtu.be/sCWOfwcYmHIjrs77 - Monday, February 12, 2018 - link
When I look at all the available benchmarks so far, then there's nothing this chip can play, that I can't allready play with my 5775C. 1080p with medium settings is no problem for most games like Overwatch, Borderlands, WoW, Diablo, etc. So if the 2400G can't run them at high settings, like it looks like, then I see no reason to call it the King of integrated graphics really.Holliday75 - Monday, February 12, 2018 - link
How on God's green Earth can you compare a $600+ CPU versus the 2400g? The whole point of iGPU is to be cheap. The 2400g out performs a CPU that costs over 3x as much in the exact area this chip was built for. Low end gaming.jrs77 - Monday, February 12, 2018 - link
$600 ?!? I paid €400 for my 5775C incl 24% VAT. So that would be $300 then.And again. I can play games in 1080p with low to medium settings just fine, so I don't see a reason to upgrade.
acidtech - Monday, February 12, 2018 - link
Need to check your math. €400 = $491.jrs77 - Tuesday, February 13, 2018 - link
Back when I bought it, the Euro and the Dollar where allmost 1:1, and to get the Dollar-price you need to subtract the 24% VAT I pay over here, so yeah, back then it was around $300. Hell, the intel list-price was $328.SaturnusDK - Wednesday, February 14, 2018 - link
So what you're saying is that you paid twice the money to have under half the graphics performance and 20% lower CPU performance of a 2400G.Graphics-wise the 5775C was pretty bad and got beaten by ALL AMD APUs at the time. It was close but it was never very good. Time has not been kind to it.
SSNSeawolf - Monday, February 12, 2018 - link
I noticed with some sadness that there's no DOTA 2 benchmarks. Was this due to time constraints or unforeseen issues? I'm crossing my fingers that DOTA 2 hasn't been dropped for good as it's a great benchmark for silicon such as this, though the other benchmarks of course do let us ballpark where it would land.Ian Cutress - Monday, February 12, 2018 - link
That's in our GPU reviews; different editors with different benchmark sets. We're looking at unifying the two.