The Intel Optane SSD 900P 280GB Review
by Billy Tallis on October 27, 2017 9:30 AM ESTBAPCo SYSmark 2014 SE
BAPCo's SYSmark 2014 SE is an application-based benchmark that uses real-world applications to replay usage patterns of business users in the areas of office productivity, media creation and data/financial analysis. In addition, it also addresses the responsiveness aspect which deals with user experience as related to application and file launches, multi-tasking etc. Scores are calibrated against a reference system that is defined to score 1000 in each of the scenarios. A score of, say, 2000, would imply that the system under test is twice as fast as the reference system.
SYSmark scores are based on total application response time as seen by the user, including not only storage latency but time spent by the processor. This means there's a limit to how much a storage improvement could possibly increase scores, because the SSD is only in use for a small fraction of the total test duration. This is a significant difference from our ATSB tests where only the storage portion of the workload is replicated and disk idle times are cut short to a maximum of 25ms.
| AnandTech SYSmark SSD Testbed | |
| CPU | Intel Core i5-7400 |
| Motherboard | ASUS B250-PLUS |
| Chipset | Intel B250 |
| Memory | 2x 8GB Kingston DDR4-2400 CL17 |
| Case | In Win C583 |
| Power Supply | Cooler Master G550M |
| OS | Windows 10 64-bit, version 1703 |
Our SSD testing with SYSmark uses a different test system than the rest of our SSD tests. This machine is set up to measure total system power consumption rather than just the drive's power.
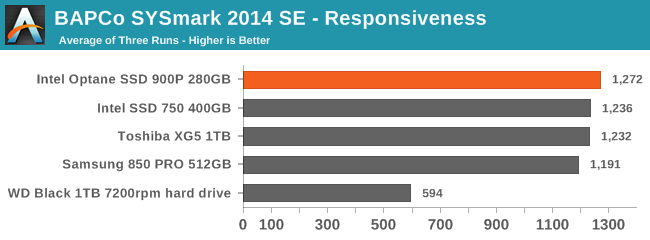
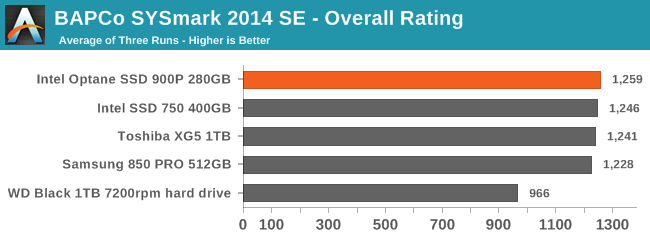
SYSmark 2014 SE doesn't come close to stressing the storage system enough to show meaningful distinctions between high-end NVMe SSDs. The Responsiveness sub-test is the most sensitive to storage performance, and only shows a few percent difference between most SSDs. The overall test barely registers a difference at all. But with my primary power meter broken, SYSmark does provide a rough assessment of how power hungry the Intel Optane SSD 900P is:
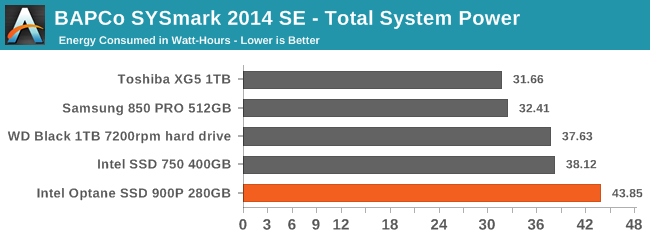
The SYSmark energy usage scores measure total system power consumption, excluding the display. Our SYSmark test system idles at around 26 W and peaks at over 60 W measured at the wall during the benchmark run. SATA SSDs seldom exceed 5 W and idle at a fraction of a watt, and the SSDs spend most of the test idle.
Despite being the fastest drive in this bunch and thus the one with the shortest SYSmark run times, the Optane SSD 900P used far more energy over the course of the three SYSmark runs. With higher idle power than even the Intel SSD 750 and similar power draw under load, the Optane SSD 900P really needs its heatsink. Intel is a very long way off from being able to package this level of performance in a M.2 SSD.


205 Comments
View All Comments
melgross - Friday, October 27, 2017 - link
You’re not as objective as you proclaim. If you were, you’d be more in line with what the conslucion says, which is that for many things there isn’t much of an advantage, but for others there is, and most of the reas\OSs aren’t the fault of this, but rather, old concepts in storage.ddriver - Friday, October 27, 2017 - link
So in order to be objective, I will have to echo what AT - a heavily pro-intel biassed website says about it? Yep, that sounds legit :)It would seem you confuse objectivity for conformity.
r0gue6 - Friday, October 27, 2017 - link
I can tell you are extremely bias simply because you use ignorant words like "hypetane" unironically.ddriver - Friday, October 27, 2017 - link
Hypetane is perfectly suited. The product turned out to be 90% hype, and it also rhymes. What more could anyone possibly want?And calling things for what they are is the very essence of objectivity.
shabby - Friday, October 27, 2017 - link
It is 1000 times faster... at die level, pcie and drivers show it down. /intel pr proddriver - Friday, October 27, 2017 - link
Sure, if you say so. I mean it is obviously saturating and exceeding the PCIE bandwidth and crippled by the PCIE latency.Oh wait, it isn't. Maybe it is intel's controller then. Who knows. I mean aside from you ;)
lmcd - Friday, October 27, 2017 - link
Ironic, because you aren't the king of anything.voicequal - Saturday, October 28, 2017 - link
It's pretty clear Intel's performance claims were speaking of the cell level (NAND vs 3D Xpoint), not the system level (SSD, SYSmark, etc).Drumsticks - Friday, October 27, 2017 - link
Not that anybody will ever convince you that anything Intel can do is good, but here is a graph of how much endurance the 480GB Optane SSD has in terms of TBW compared to the other Pro SSDs.https://www.pcper.com/files/imagecache/article_max...
ddriver - Friday, October 27, 2017 - link
Cool, even if not real-world maxing out but intel's claim, I am willing to assume that intel won't lie on the spec sheet of an actual product.But then again, I am going to refer you to this little gem:
http://images.hardwarecanucks.com/image/akg/Storag...
The rated number is still almost 50 times less than what intel claimed officially. 45 times less is pretty significant IMO. Imagine getting a job where they promise you 20k $ a month, and end up paying you 450$ instead. Not cool. In light of that, I wouldn't say my criticism is ungrounded.
For me personally, 20 times better endurance than NAND is pretty good, good enough to justify the purchase even at the present price.
Now if only intel started out with a 20x claim instead of the 1000x claim, I wouldn't have any legit reason to bash that product. And maybe if more call intel on their BS, they just might cut it. And I don't think that will be a bad thing.