The AnandTech Coffee Lake Review: Initial Numbers on the Core i7-8700K and Core i5-8400
by Ian Cutress on October 5, 2017 9:00 AM EST- Posted in
- CPUs
- Intel
- Core i5
- Core i7
- Core i3
- 14nm
- Coffee Lake
- 14++
- Hex-Core
- Hyperthreading
Benchmarking Performance: CPU Rendering Tests
Rendering tests are a long-time favorite of reviewers and benchmarkers, as the code used by rendering packages is usually highly optimized to squeeze every little bit of performance out. Sometimes rendering programs end up being heavily memory dependent as well - when you have that many threads flying about with a ton of data, having low latency memory can be key to everything. Here we take a few of the usual rendering packages under Windows 10, as well as a few new interesting benchmarks.
All of our benchmark results can also be found in our benchmark engine, Bench.
Corona 1.3: link
Corona is a standalone package designed to assist software like 3ds Max and Maya with photorealism via ray tracing. It's simple - shoot rays, get pixels. OK, it's more complicated than that, but the benchmark renders a fixed scene six times and offers results in terms of time and rays per second. The official benchmark tables list user submitted results in terms of time, however I feel rays per second is a better metric (in general, scores where higher is better seem to be easier to explain anyway). Corona likes to pile on the threads, so the results end up being very staggered based on thread count.
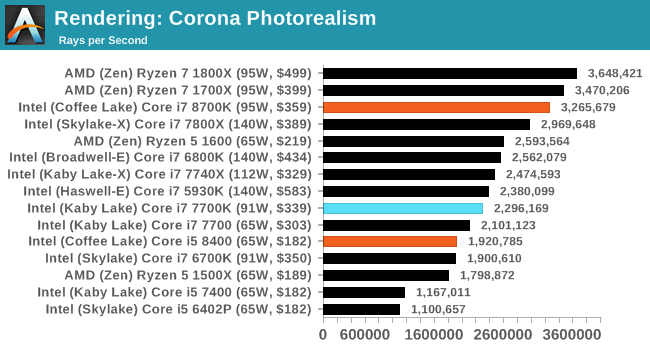
With more threads on display, the Core i7-8700K gets ahead of the previous mainstream Core i7 parts. The frequency difference over the Skylake-X processor gives an extra +10% performance, but the 16-thread parts from AMD win out overall.
Blender 2.78: link
For a render that has been around for what seems like ages, Blender is still a highly popular tool. We managed to wrap up a standard workload into the February 5 nightly build of Blender and measure the time it takes to render the first frame of the scene. Being one of the bigger open source tools out there, it means both AMD and Intel work actively to help improve the codebase, for better or for worse on their own/each other's microarchitecture.
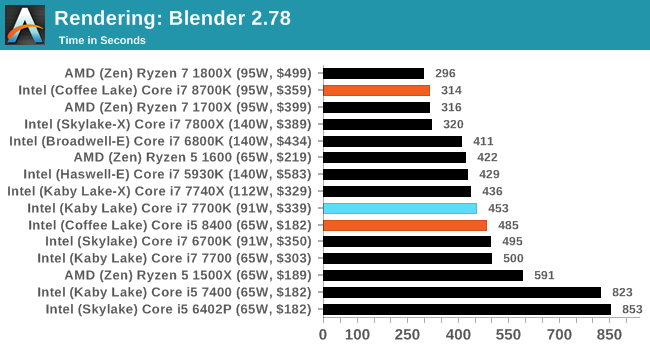
Blender seems to separate very nicely into core counts, with six cores from Intel matching eight cores from AMD.
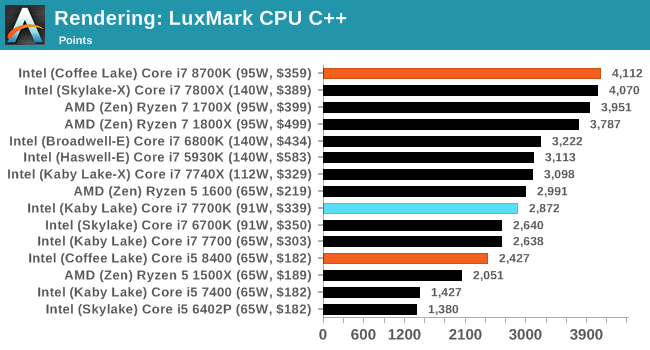
LuxMark v3.1: Link
As a synthetic, LuxMark might come across as somewhat arbitrary as a renderer, given that it's mainly used to test GPUs, but it does offer both an OpenCL and a standard C++ mode. In this instance, aside from seeing the comparison in each coding mode for cores and IPC, we also get to see the difference in performance moving from a C++ based code-stack to an OpenCL one with a CPU as the main host.
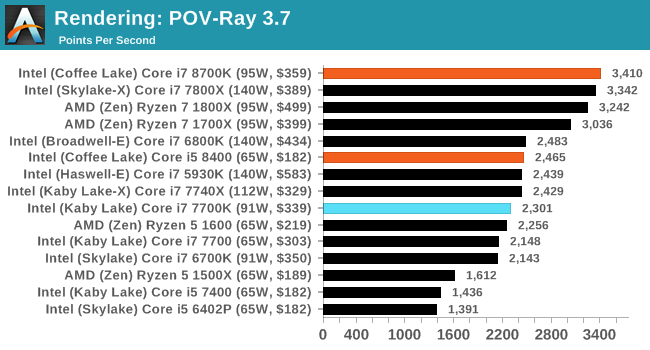
POV-Ray 3.7.1b4: link
Another regular benchmark in most suites, POV-Ray is another ray-tracer but has been around for many years. It just so happens that during the run up to AMD's Ryzen launch, the code base started to get active again with developers making changes to the code and pushing out updates. Our version and benchmarking started just before that was happening, but given time we will see where the POV-Ray code ends up and adjust in due course.
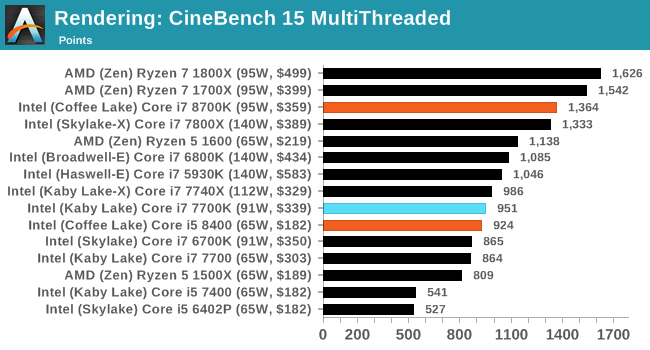
Cinebench R15: link
The latest version of CineBench has also become one of those 'used everywhere' benchmarks, particularly as an indicator of single thread performance. High IPC and high frequency gives performance in ST, whereas having good scaling and many cores is where the MT test wins out.
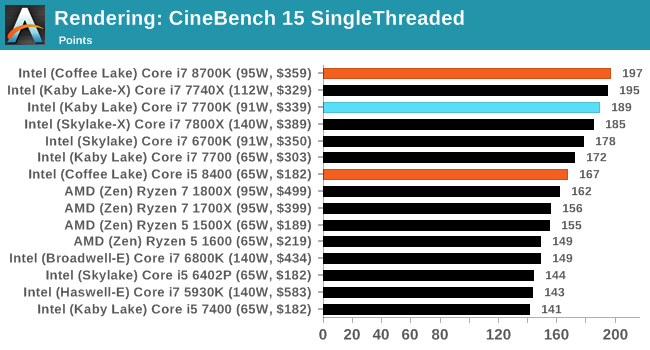
CineBench R15 in single thread mode can take the Core i7-8700K by the horns and drag it to be the best performing chip ever tested.


222 Comments
View All Comments
mapesdhs - Monday, October 9, 2017 - link
I'm not sure. :D It's certainly annoying though. Worst part is searching for anything and then changing the list order to cheapest first, what a mess...SunnyNW - Thursday, October 5, 2017 - link
"That changes today."Anyone else read that and think that it is something we should have been reading ages ago?
Consumer technology is progressing slower than many expected and I feel the same way. Nonetheless I can't help but envision a Very near future where I'll be coming back and reading this article and being depressed at this level of technology all the while on my future monolithic many thousand core 3D processor ;)
KAlmquist - Friday, October 6, 2017 - link
Yes. A year ago this would have been an exciting development. Now it's just Intel remaining competitive against AMD's offerings.Valcoma - Thursday, October 5, 2017 - link
"The Core i5-8400 ($182) and Core i3-8350K ($169) sit near the Ryzen 5 1500X ($189) and the Ryzen 5 1400 ($169) respectively. Both the AMD parts are six cores and twelve threads, up against the 6C/6T Core i5 and the 4C/4T Core i3. The difference between the Ryzen 4 1400 and the Core i3-8350K would be interesting, given the extreme thread deficit between the two."Those AMD parts are 4 cores, 8 threads.
Ian Cutress - Thursday, October 5, 2017 - link
You're right, had a brain spasm while writing that bit. Updated.kpb321 - Thursday, October 5, 2017 - link
Still off"The difference between the Ryzen 5 1500X and the Core i3-8350K would be interesting, given the extreme thread deficit (12 threads vs 4) between the two."
the 1500X is a 4c8t processor so it effectively has hyper-threading over the i3-8350K while having a lower overclocking ceiling and lower ipc.
Zingam - Saturday, October 7, 2017 - link
Drinking too much Coffee, eh?hansmuff - Thursday, October 5, 2017 - link
Ian, I love the way the gaming benchmarks are listed. So easy to access and much less confusing than drop-downs or arrows. Nice job!Valcoma - Thursday, October 5, 2017 - link
Are you sure that the i5-7400 got 131 FPS average in benchmark 1 - Spine of the Mountain in Rise of the Tomb Raider? Besting all the other vastly superior processors?Looks like a typing error there or something went wrong with your benchmark (lower settings for example on that run).
Ian Cutress - Thursday, October 5, 2017 - link
I've mentioned it in several reviews in the past: RoTR stage 1 is heavily optimized for quad core. Check our Bench results - the top eight CPUs are all 4C/4T. The minute you add threads, the results plummet.https://www.anandtech.com/bench/CPU/1827