The AnandTech Coffee Lake Review: Initial Numbers on the Core i7-8700K and Core i5-8400
by Ian Cutress on October 5, 2017 9:00 AM EST- Posted in
- CPUs
- Intel
- Core i5
- Core i7
- Core i3
- 14nm
- Coffee Lake
- 14++
- Hex-Core
- Hyperthreading
Shadow of Mordor
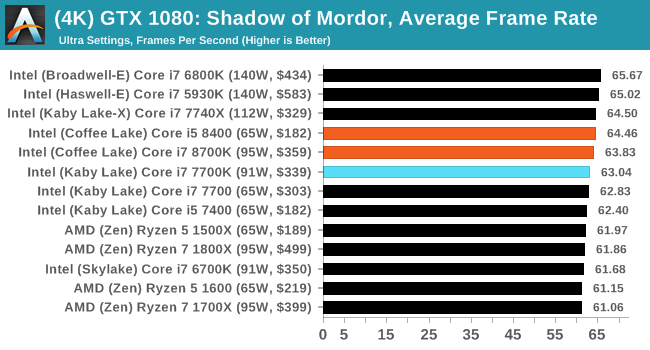
The next title in our testing is a battle of system performance with the open world action-adventure title, Middle Earth: Shadow of Mordor (SoM for short). Produced by Monolith and using the LithTech Jupiter EX engine and numerous detail add-ons, SoM goes for detail and complexity. The main story itself was written by the same writer as Red Dead Redemption, and it received Zero Punctuation’s Game of The Year in 2014.

A 2014 game is fairly old to be testing now, however SoM has a stable code and player base, and can still stress a PC down to the ones and zeroes. At the time, SoM was unique, offering a dynamic screen resolution setting allowing users to render at high resolutions that are then scaled down to the monitor. This form of natural oversampling was designed to let the user experience a truer vision of what the developers wanted, assuming you had the graphics hardware to power it but had a sub-4K monitor.
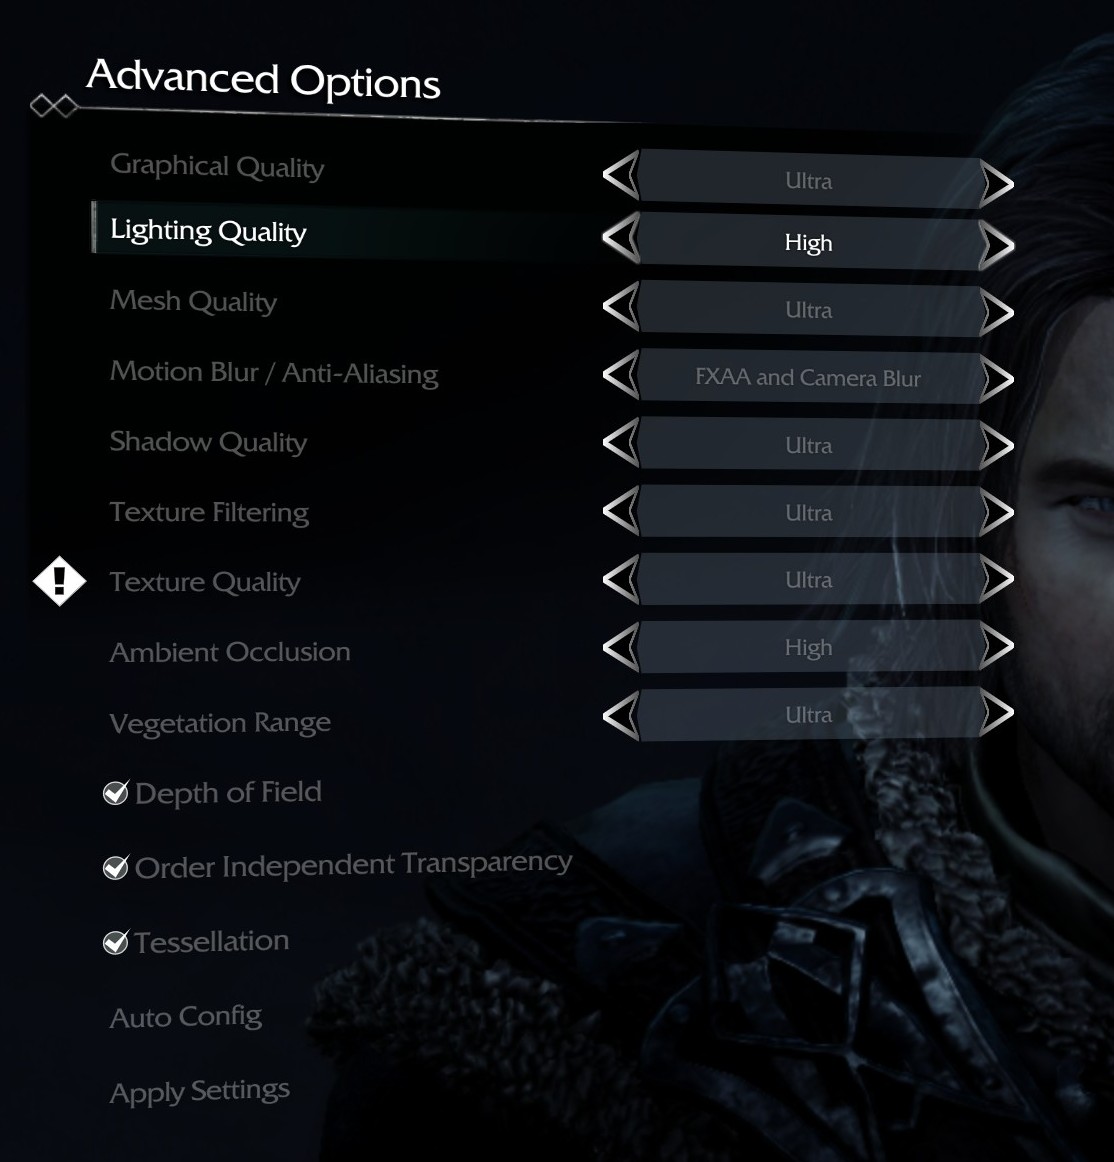
The title has an in-game benchmark, for which we run with an automated script implement the graphics settings, select the benchmark, and parse the frame-time output which is dumped on the drive. The graphics settings include standard options such as Graphical Quality, Lighting, Mesh, Motion Blur, Shadow Quality, Textures, Vegetation Range, Depth of Field, Transparency, and Tessellation. There are standard presets as well.
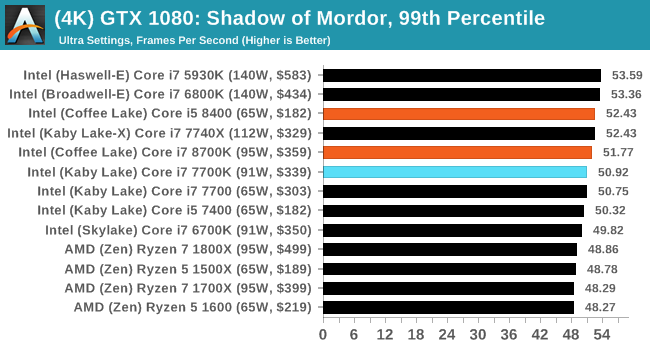
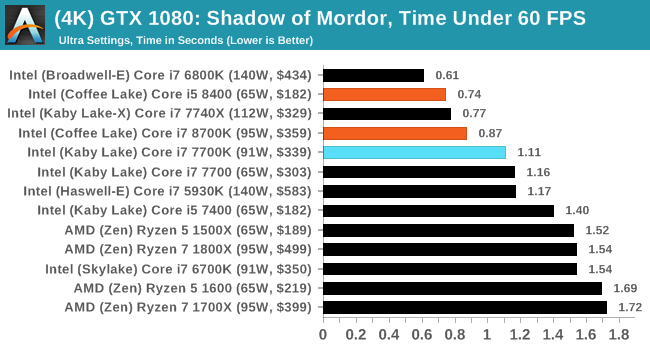
We run the benchmark at 1080p and a native 4K, using our 4K monitors, at the Ultra preset. Results are averaged across four runs and we report the average frame rate, 99th percentile frame rate, and time under analysis.
All of our benchmark results can also be found in our benchmark engine, Bench.
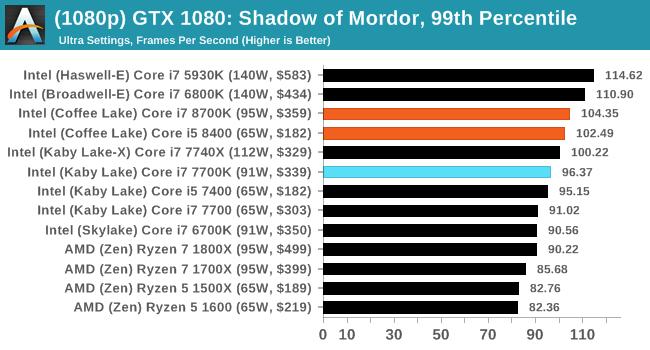
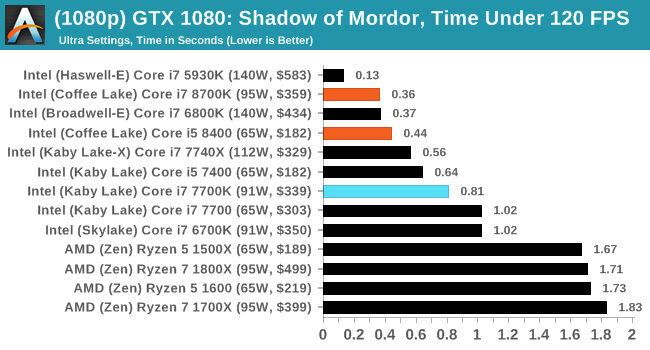
MSI GTX 1080 Gaming 8G Performance
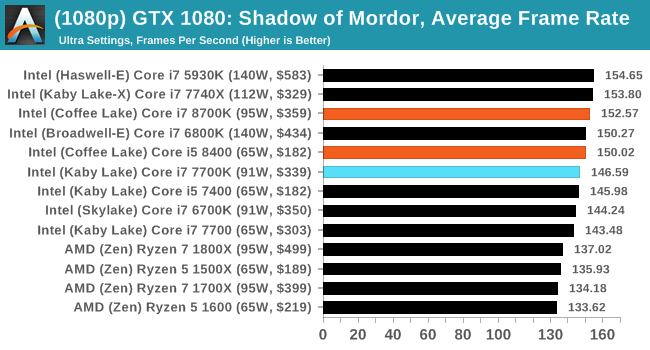
1080p
4K


222 Comments
View All Comments
watzupken - Thursday, October 5, 2017 - link
I don't know how you define as "best" for review graph. The point is that we are seeing new 6 cores solution from Intel, so very logically, people will be trying to compare apples with apples, i.e. 6 core solutions from both camps. So omitting the results from 1600 actually looks more than meets the eye to me, especially when you folks previously did a R5 1600X review.Ian Cutress - Thursday, October 5, 2017 - link
I'm adding the R5 1600 data. It'll take 10-15 minutes, it's not a quick process. brbwatzupken - Thursday, October 5, 2017 - link
Thank you Ian. Please do add the data for R5 1600/X. From what I read elsewhere, it appears there is good competition between the Core i5 and R5 1600/X series.Ian Cutress - Thursday, October 5, 2017 - link
OK, should be added. You might have to CTRL+F5 to clear the cache to see the updated versions.WinterCharm - Thursday, October 5, 2017 - link
Thanks Ian!It really is the most logical and fair comparison.
WinterCharm - Thursday, October 5, 2017 - link
You really should have chosen SIMILARLY priced chips (So, 1700 / 1600 / 1600X) because it would have shown "here's the performance you get per dollar" which ultimately is what matters.Ian Cutress - Thursday, October 5, 2017 - link
My ultimate goal is to have a graph widget that lets you select which CPU you want to focus on, and it automatically pulls in several around that price point as well as some of the same family. I'm not that skilled, thoughError415 - Thursday, October 5, 2017 - link
Performane per dollar doesn't matter, out right performance matters. SMH, only a fool buys the second best cpu when the best is only a few dollars more.zuber - Thursday, October 5, 2017 - link
You basically just said "performance per dollar doesn't matter, only a fool ignores performance per dollar".sonny73n - Friday, October 6, 2017 - link
+1