The AnandTech Coffee Lake Review: Initial Numbers on the Core i7-8700K and Core i5-8400
by Ian Cutress on October 5, 2017 9:00 AM EST- Posted in
- CPUs
- Intel
- Core i5
- Core i7
- Core i3
- 14nm
- Coffee Lake
- 14++
- Hex-Core
- Hyperthreading
Benchmarking Performance: CPU System Tests
Our first set of tests is our general system tests. These set of tests are meant to emulate more about what people usually do on a system, like opening large files or processing small stacks of data. This is a bit different to our office testing, which uses more industry standard benchmarks, and a few of the benchmarks here are relatively new and different.
All of our benchmark results can also be found in our benchmark engine, Bench.
Strategic AI
One of the hot button topics this year (and for the next few years, no doubt) is how technology is shifting to using artificial intelligence and purpose built AI hardware to perform better analysis in low power environments. AI is not relatively new as a concept, as we have had it for over 50 years. What is new is the movement to neural network based training and inference: moving from ‘if this then that’ sort of AI to convolutional networks that can perform fractional analysis of all the parameters.
Unfortunately the movement of the neural-network ecosystem is fast paced right now, especially in software. Every few months or so, announcements are made on new software frameworks, improvements in accuracy, or fundamental paradigm shifts in how these networks should be calculated for accuracy, power, performance, and what the underlying hardware should support in order to do so. There is no situational AI benchmarking tools using network topologies that will remain relevant in 2-4 months, let alone an 18-24 month processor benchmark cycle. So to that end our AI test becomes the best of the rest: strategic AI in the latest video games.
For our test we use the in-game Civilization 6 AI benchmark with a few custom modifications. Civilization is one of the most popular strategy video games on the market, heralded for its ability for extended gameplay and for users to suddenly lose 8 hours in a day because they want to play ‘one more turn’. A strenuous setting would involve a large map with 20 AI players on the most difficult settings, leading to a turn time (waiting for the AI players to all move in one turn) to exceed several minutes on a mid-range system. Note that a Civilization game can easily run for over 500 turns and be played over several months due to the level of engagement and complexity.
Before the benchmark is run, we change the game settings for medium visual complexity at a 1920x1080 resolution while using a GTX 1080 graphics card, such that any rendered graphics are not interfering with the benchmark measurements. Our benchmark run uses a command line method to call the built-in AI benchmark, which features 8 AI players on a medium size map but in a late game scenario with most of the map discovered, each civilization in the throes of modern warfare. We set the benchmark to play for 15 turns, and output the per-turn time, which is then read into the script with the geometric mean calculated. This benchmark is newer than most of the others, so we only have a few data points so far:
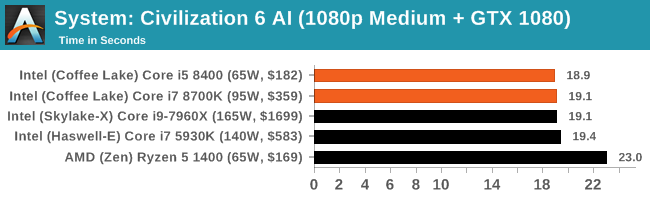
Our Strategic AI test is new to the scene, and it looks like there is at least an asymptotic result wken you have a 'good enough' processor.
PDF Opening
First up is a self-penned test using a monstrous PDF we once received in advance of attending an event. While the PDF was only a single page, it had so many high-quality layers embedded it was taking north of 15 seconds to open and to gain control on the mid-range notebook I was using at the time. This put it as a great candidate for our 'let's open an obnoxious PDF' test. Here we use Adobe Reader DC, and disable all the update functionality within. The benchmark sets the screen to 1080p, opens the PDF to in fit-to-screen mode, and measures the time from sending the command to open the PDF until it is fully displayed and the user can take control of the software again. The test is repeated ten times, and the average time taken. Results are in milliseconds.
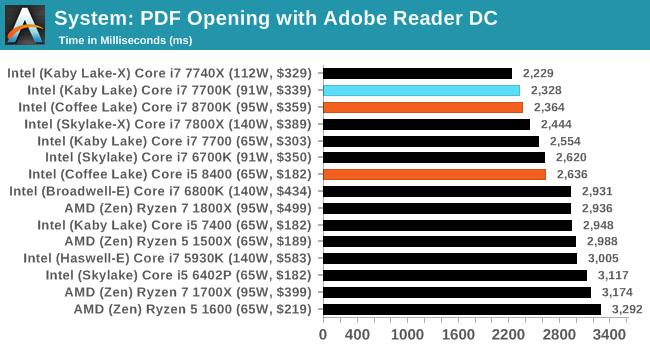
Single thread frequency usualy works well for PDF Opening, although as we add on more high performance cores it becomes more difficult for the system to pin that individual thread to a single core and get the full turbo boost - if anything flares up on any other core then it brings the frequencies down. I suspect that is what is happening here and the next couple of thests where the i7-8700K sits behind the i7-7700K and i7-7740X.
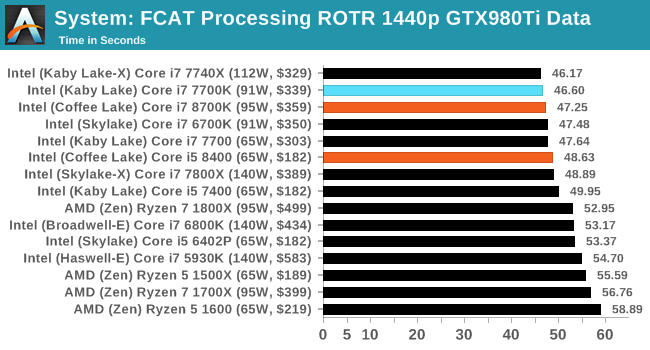
FCAT Processing: link
One of the more interesting workloads that has crossed our desks in recent quarters is FCAT - the tool we use to measure stuttering in gaming due to dropped or runt frames. The FCAT process requires enabling a color-based overlay onto a game, recording the gameplay, and then parsing the video file through the analysis software. The software is mostly single-threaded, however because the video is basically in a raw format, the file size is large and requires moving a lot of data around. For our test, we take a 90-second clip of the Rise of the Tomb Raider benchmark running on a GTX 980 Ti at 1440p, which comes in around 21 GB, and measure the time it takes to process through the visual analysis tool.
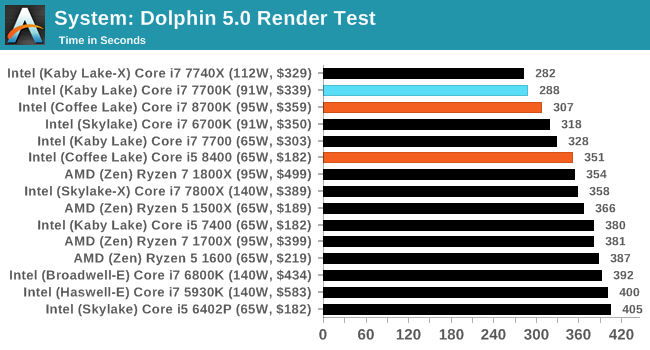
Dolphin Benchmark: link
Many emulators are often bound by single thread CPU performance, and general reports tended to suggest that Haswell provided a significant boost to emulator performance. This benchmark runs a Wii program that ray traces a complex 3D scene inside the Dolphin Wii emulator. Performance on this benchmark is a good proxy of the speed of Dolphin CPU emulation, which is an intensive single core task using most aspects of a CPU. Results are given in minutes, where the Wii itself scores 17.53 minutes.
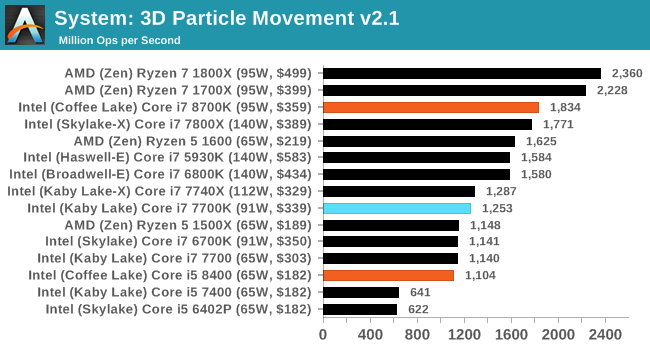
3D Movement Algorithm Test v2.1: link
This is the latest version of the self-penned 3DPM benchmark. The goal of 3DPM is to simulate semi-optimized scientific algorithms taken directly from my doctorate thesis. Version 2.1 improves over 2.0 by passing the main particle structs by reference rather than by value, and decreasing the amount of double->float->double recasts the compiler was adding in. It affords a ~25% speed-up over v2.0, which means new data.
DigiCortex v1.20: link
Despite being a couple of years old, the DigiCortex software is a pet project for the visualization of neuron and synapse activity in the brain. The software comes with a variety of benchmark modes, and we take the small benchmark which runs a 32k neuron/1.8B synapse simulation. The results on the output are given as a fraction of whether the system can simulate in real-time, so anything above a value of one is suitable for real-time work. The benchmark offers a 'no firing synapse' mode, which in essence detects DRAM and bus speed, however we take the firing mode which adds CPU work with every firing.
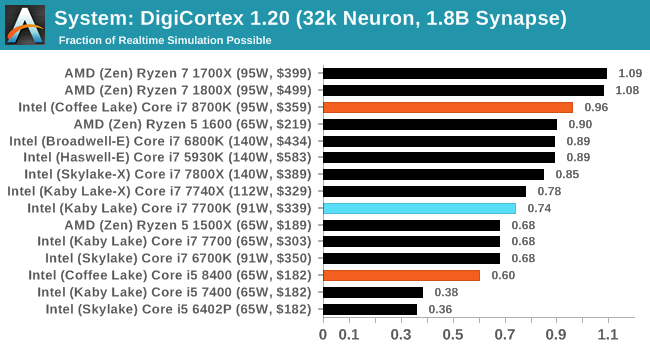
DigiCortex can take advantage of the extra cores, paired with the faster DDR4-2666 memory. The Ryzen 7 chips still sit at the top here however.
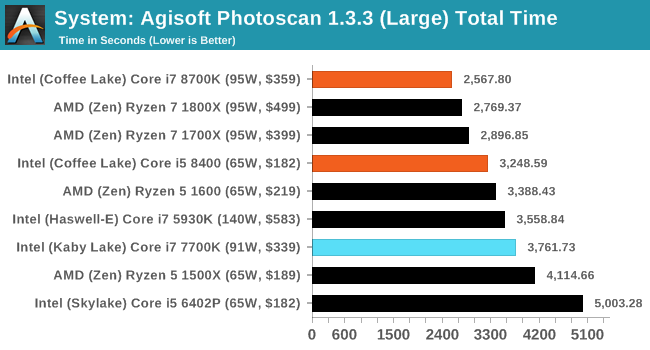
Agisoft Photoscan 1.3.3: link
Photoscan stays in our benchmark suite from the previous version, however now we are running on Windows 10 so features such as Speed Shift on the latest processors come into play. The concept of Photoscan is translating many 2D images into a 3D model - so the more detailed the images, and the more you have, the better the model. The algorithm has four stages, some single threaded and some multi-threaded, along with some cache/memory dependency in there as well. For some of the more variable threaded workload, features such as Speed Shift and XFR will be able to take advantage of CPU stalls or downtime, giving sizeable speedups on newer microarchitectures. The 1.3.3 test is relatively new, so has only been run on a few parts so far.


222 Comments
View All Comments
xchaotic - Monday, October 9, 2017 - link
Well yeah, but even with non-HT i5 and i3, you still have plenty of cores to work with.Even if the OS (or a background task - say Windows Defender?) takes up a thread, you still have other cores for your game engine.nierd - Monday, October 9, 2017 - link
Do we? I've yet to see a good benchmark that measures task switching and multiple workloads - they measure 'program a' that is bad at using cores - and 'program b' that is good at using cores.In today's reality - few people are going to need maximum single program performance. Outside of very specific types of workloads (render farming or complex simulations for science) please show me the person that is just focused on a single program. I want to see side by side how these chips square off when you have multiple completing workloads that force the scheduler to balance tasks and do multiple context shifting etc. We used to see benchmarks back in the day (single core days) where they'd do things like run a program designed to completely trash the predictive cache so we'd see 'worst case' performance, and things that would stress a cpu. Now we run a benchmark suite that shows you how fast handbrake runs *if it's the only thing you run*.
mapesdhs - Tuesday, October 10, 2017 - link
I wonder if there's pressure never to test systems in that kind of real-world manner, perhaps the results would not be pretty. Not so much a damnation of the CPU, rather a reflection of the OS. :D Windows has never been that good at this sort of thing.boeush - Monday, October 9, 2017 - link
An *intelligent* OS thread scheduler would group low-demand/low-priority threads together, to multitask on one or two cores, while placing high-priority and high-CPU-utilization threads on respective dedicated cores. This would maximize performance and avoid trashing the cache, where and when it actually matters.If Windows 10 makes consistent single-thread performance hard to obtain, then the testing is revealing a fundamental problem (really, a BUG) with the OS' scheduler - not a flaw in benchmarking methodology...
samer1970 - Monday, October 9, 2017 - link
I fail to understand how you guys review a CPU meant for overclocking and only put non OC results in your tables ?If I wanted the i7 8700K without overclocking I would pick up the i7 8700 ans save $200 for both cooling and cheaper motherboard. and the i7 8700 can turbo all 6 cores to 4.3Ghz just like the i7 8700K
someonesomewherelse - Saturday, October 14, 2017 - link
Classic Intel, can't they make a chipset/socket with extra power pins so it would last for at least a few cpu generations?Gastec - Saturday, October 14, 2017 - link
I'm getting lost in all these CPU releases this year, it feels like there is a new CPU coming out every 2 months. Don't get me wrong, I like to have many choices but this is pathetic really. Someone is really desperate for more money.zodiacfml - Sunday, October 15, 2017 - link
The i3!lordken - Saturday, October 28, 2017 - link
cant you make bars for amd cpus red in graphs? Its crap to search for them if all lines are black (at least 7700k was highlighted in some)a bit disappointed, not a single world of ryzen/amd on summary page, you compare only to intel cpus? how come?
why only 1400 in civ AI test and not any R7/5 CPUs?
Also I would expect you hammer down intel a bit more on that not-so-same socket crap.
Ritska - Friday, November 3, 2017 - link
Why is 6800k faster then 7700k and 8700k in gaming? Is it worth buying if I can get one for 300$?