The AnandTech Coffee Lake Review: Initial Numbers on the Core i7-8700K and Core i5-8400
by Ian Cutress on October 5, 2017 9:00 AM EST- Posted in
- CPUs
- Intel
- Core i5
- Core i7
- Core i3
- 14nm
- Coffee Lake
- 14++
- Hex-Core
- Hyperthreading
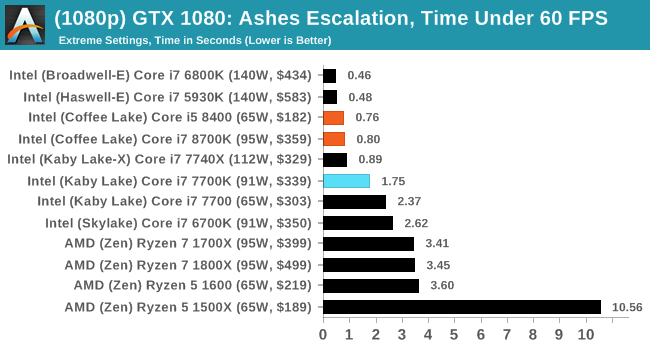
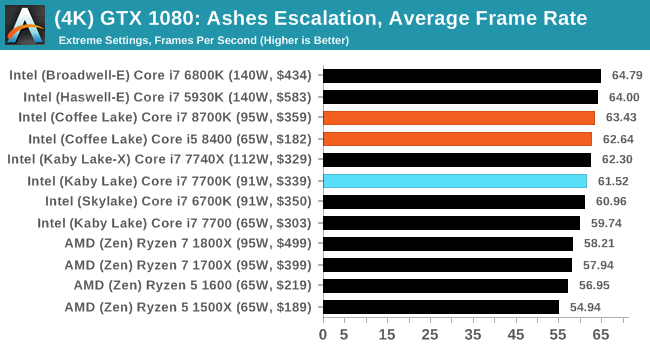
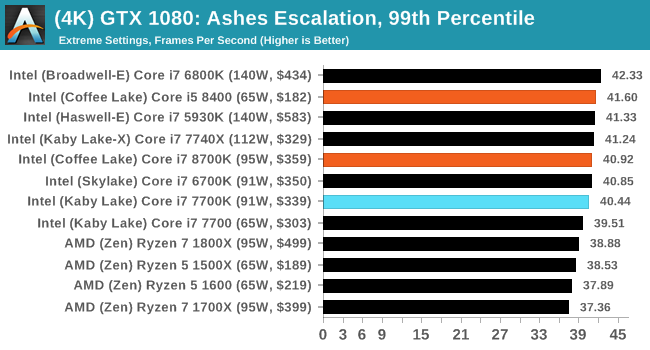
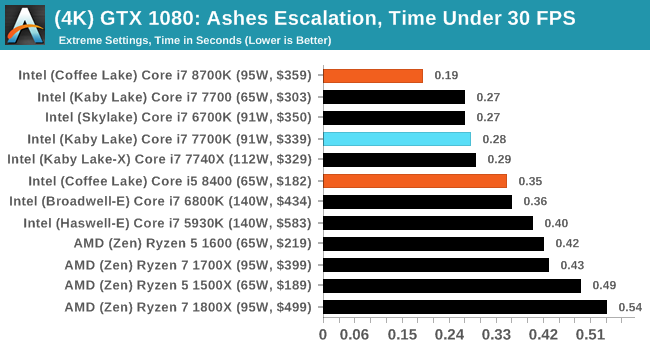
Ashes of the Singularity Escalation
Seen as the holy child of DirectX12, Ashes of the Singularity (AoTS, or just Ashes) has been the first title to actively go explore as many of DirectX12s features as it possibly can. Stardock, the developer behind the Nitrous engine which powers the game, has ensured that the real-time strategy title takes advantage of multiple cores and multiple graphics cards, in as many configurations as possible.
As a real-time strategy title, Ashes is all about responsiveness during both wide open shots but also concentrated battles. With DirectX12 at the helm, the ability to implement more draw calls per second allows the engine to work with substantial unit depth and effects that other RTS titles had to rely on combined draw calls to achieve, making some combined unit structures ultimately very rigid.
Stardock clearly understand the importance of an in-game benchmark, ensuring that such a tool was available and capable from day one, especially with all the additional DX12 features used and being able to characterize how they affected the title for the developer was important. The in-game benchmark performs a four-minute fixed seed battle environment with a variety of shots, and outputs a vast amount of data to analyze.
For our benchmark, we run a fixed v2.11 version of the game due to some peculiarities of the splash screen added after the merger with the standalone Escalation expansion, and have an automated tool to call the benchmark on the command line. (Prior to v2.11, the benchmark also supported 8K/16K testing, however v2.11 has odd behavior which nukes this.)
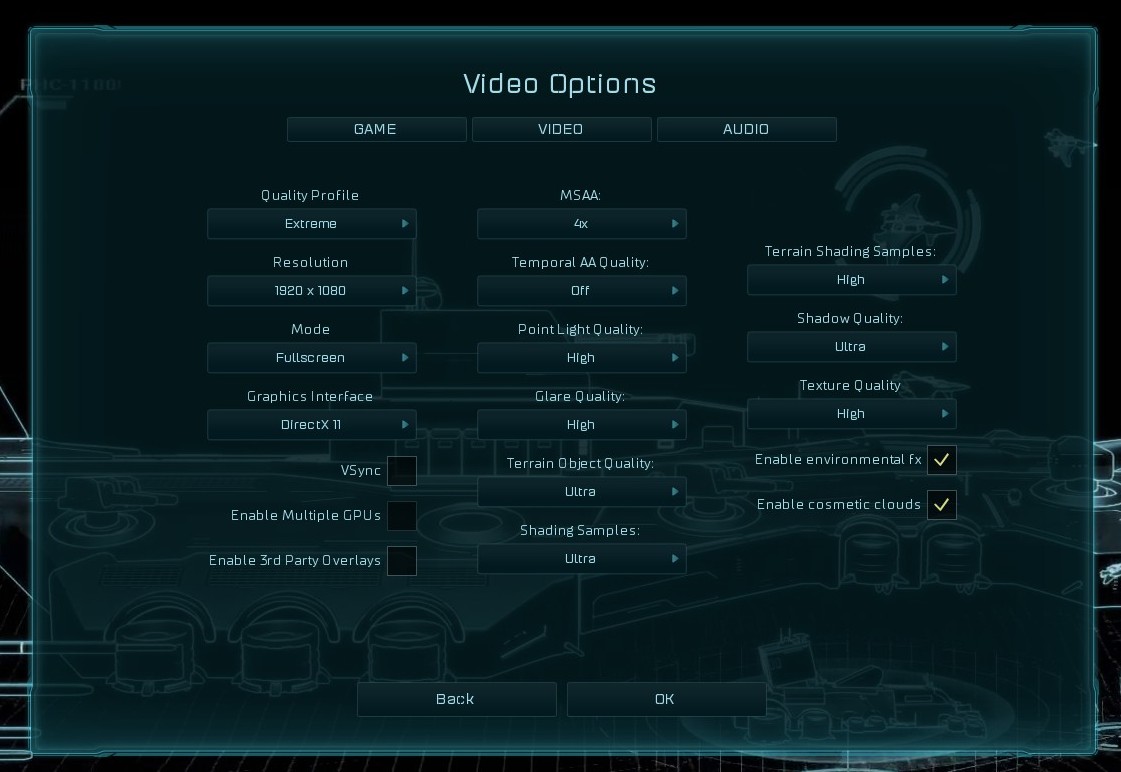
At both 1920x1080 and 4K resolutions, we run the same settings. Ashes has dropdown options for MSAA, Light Quality, Object Quality, Shading Samples, Shadow Quality, Textures, and separate options for the terrain. There are several presents, from Very Low to Extreme: we run our benchmarks at Extreme settings, and take the frame-time output for our average, percentile, and time under analysis.
All of our benchmark results can also be found in our benchmark engine, Bench.
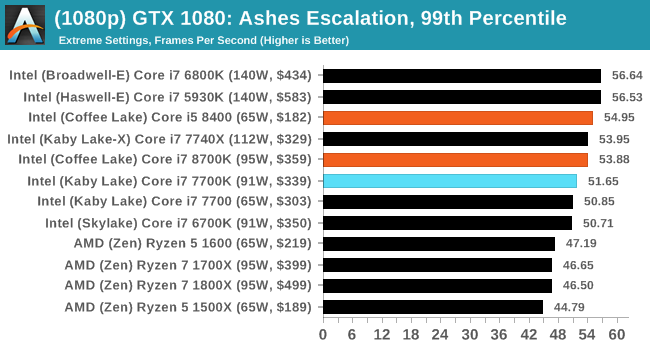
MSI GTX 1080 Gaming 8G Performance
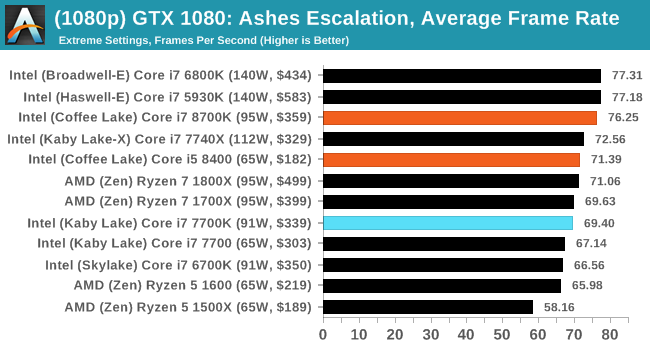
1080p
4K


222 Comments
View All Comments
Ian Cutress - Saturday, October 7, 2017 - link
That was a mistake on my part. On that I'm still mentally in an era where 150 MHz is a 10% gain. My quick mental arithmetic failed.ScottSoapbox - Thursday, October 5, 2017 - link
It's a shame you didn't compare it to the 7820X. I think it was expected that it would better the 7800X at least to some degree, so the more interesting comparison is how much performance does the added cost of 8 cores get you.Ryan Smith - Thursday, October 5, 2017 - link
The graphs were already getting ridiculously long. For something like that, be sure to look at Bench: https://www.anandtech.com/bench/product/1904?vs=20...realistz - Thursday, October 5, 2017 - link
AMD panic mode. Price drop imminent.Anonymous Blowhard - Thursday, October 5, 2017 - link
Price drop already happened. R7 1700X now USD$300 on Amazon.willis936 - Thursday, October 5, 2017 - link
I'd like to see the memory testing done on Ryzen done on coffee lake as well. It's clear that 2 DDR4 channels is not enough for 8 cores, at least with AMD's memory subsystem. Is it enough for 6 cores with Intel's memory subsystem? Also please be sure to use a GPU powerful enough to warrant even reporting the gaming results.bharatwd - Thursday, October 5, 2017 - link
Kabylake is faster than Coffeelake. where is the 15% increase? what is the point of + and ++ iteration when there is no improvement in performance? intel is just burning wafers for no reason. Better for them to go back to tick tock clock and stop wasting resources................SunnyNW - Thursday, October 5, 2017 - link
Honestly I'm not sure why Intel doesn't just keep fab lines for the 7th gen i5s going and just re-label into the 8th gen i3s and just bin differently, ie higher base/turbo.AleXopf - Thursday, October 5, 2017 - link
Thanks for the review Ian. Just one question. Why do you think power consumption differs so much with the data from techspot, were the 8700k consumes 190w, and it's on par with the 16c32t 1920x?Ian Cutress - Saturday, October 7, 2017 - link
Are they testing at-wall power consumption at stock? That might add a bunch.Our power numbers are just for the CPU, not the at wall - they are derived from the internal calibration tools that the processor uses to determine its own power P-states, which in effect is directly related to the turbo.
There seems to be a lot of boards that screw around with multi-core turbo this generation, which may also lead to higher power consumption numbers.