Retesting AMD Ryzen Threadripper’s Game Mode: Halving Cores for More Performance
by Ian Cutress on August 17, 2017 12:01 PM ESTAnalyzing Creator Mode and Game Mode
In this review, we posted every graph with both the Creator Mode results (as default) and the Game Mode results (as 1950X-GM) for the Threadripper 1950X. There were a number of trends worth pointing out.
The first big answer is that in (almost) every multi threaded benchmark that relied on all the threads pushing out data, Game Mode scored considerably less than Creator Mode. In our test suite, I earmarked 19 different tests that are designed to scale with thread count, and the results ranged from +1% (Octane) down to -48% (Corona) and -45% (LuxMark). To summarize, anything that wanted serious throughput, Game Mode was not the right mode to be in. But anyone could have told you that.
The next element is the single threaded tests in the suite. There are 10 of these if we include the four legacy benchmarks, and for the most part these are all within 5% of the Creator Mode results – some are above and some are below, but nothing majorly drastic. Two of the benchmarks, however, did get significant jumps from using Game Mode: Dolphin (+9%) and Agisoft Stage 3 (+38%). Agisoft is probably a hollow victory as overall that test only gains by 1%.
We do run a few variable threaded loads, and the results here really depend on how much of a parallel task it is. As stated before, Agisoft goes up 1%, and perhaps surprisingly our Compile benchmark goes down 14%. One would have thought that the faster memory latency of Game Mode might counteract the lack of threads, especially when the L3 victim cache is of little use, but overall it would seem that our compile test likes the threads instead. WinRAR is a known memory-loving test, so Game Mode picked up a 3% win, and the web benchmarks that are variable threaded such as WebXPRT also picked up a 9% win.
CPU Gaming Tests
Now we turn to our gaming tests. Because we test six different games with four different GPUs at two different resolutions, and in each case take averages and 99th percentiles, I’m going to present this data in a set of different ways. First, the overall gains based on the resolution:
| Game Mode Gains Over Creative Mode | ||
| 1080p | 4K | |
| Average | +0.6% | +0.6% |
| 99th | +14.3% | +8.0% |
The two elements we can draw here are that Game Mode is beneficial mostly for 99th percentiles, but also it affects 1080p gaming over 4K gaming more.
This next table breaks it down by graphics card:
| Game Mode Gains Over Creative Mode | ||
| NVIDIA GTX 1080 | 1080p | 4K |
| Average | -3.1% | 0.0% |
| 99th | +1.6% | +1.9% |
| NVIDIA GTX 1060 | 1080p | 4K |
| Average | -0.6% | +0.1% |
| 99th | +3.1% | +1.9% |
| AMD R9 Fury | 1080p | 4K |
| Average | +2.5% | +1.5% |
| 99th | +26.2% | +14.4% |
| AMD RX 480 | 1080p | 4K |
| Average | +3.6% | +0.6% |
| 99th | +25.0% | +14.1% |
Again, the data shows that 99th percentiles fare better over averages, although the AMD cards get a better uplift than the NVIDIA cards.
Now let us break it down by game tests.
| Game Mode Gains Over Creative Mode | ||
| Civilization 6 | 1080p | 4K |
| Average | -2.1% | -1.8% |
| 99th | -5.3% | -3.1% |
| Ashes of the Singularity | 1080p | 4K |
| Average | -3.2% | -0.1% |
| 99th | -2.2% | -0.6% |
| Shadow of Mordor | 1080p | 4K |
| Average | -0.3% | 0.0% |
| 99th | -4.5% | +0.1% |
Both Civilization 6 and Ashes of The Singularity slight decreases running in Game Mode, with 4K Civilization even regresses 5% in 99th percentile data. Shadow of Mordor has some gains at 4K, mainly with 99th percentile data, but well within the margin of error.
| Game Mode Gains Over Creative Mode | ||
| RoTR-1 | 1080p | 4K |
| Average | -1.3% | +0.1% |
| 99th | +4.2% | +0.4% |
| RoTR-2 | 1080p | 4K |
| Average | +2.4% | +1.8% |
| 99th | +43.7% | +21.9% |
| RoTR-3 | 1080p | 4K |
| Average | +2.3% | +1.4% |
| 99th | +17.9% | +11.7% |
Rise of the Tomb Raider has three test stages, and almost all of them benefit from Game Mode. Again, 99th percentiles go up (+43.7% for the Prophets Tomb test), and 1080p gets the better deal over 4K data.
| Game Mode Gains Over Creative Mode | ||
| Rocket League | 1080p | 4K |
| Average | +0.8% | +1.0% |
| 99th | +9.1% | +2.9% |
| Grand Theft Auto V | 1080p | 4K |
| Average | +6.9% | +2.2% |
| 99th | +49.2% | +29.4% |
The last two games are Rocket League and Grand Theft Auto, with Rocket League getting a small bump in 99th percentiles but GTA jumps up double digits. For GTA, those big number spikes at 1080p come from ~100% gains on AMD cards. Similarly at 4K, while NVIDIA cards get nearly no benefit, AMD cards gain 50-73%.
Conclusions on CPU Gaming
Looking at the overall data, the worst loss was a -10% at 4K for Civilization 6, and it's almost a complete mix of positive and negative results across the 256 data points we tested. The takeaway is that on average Game Mode affects certain games really, really well, like RoTR and GTA, but not games like Ashes or Shadow of Mordor. On average that equates to a +8% boost in 99th percentile frame rates at 4K or a +14% boost in 99th percentile frame rates at 1080p, and mostly limited to AMD cards.
If a user wants to use Threadripper to play certain games when using an AMD card, they should be in Game Mode. There are some losses in some titles, but as a catch all situation, the gains for games where it does work are noticable, espeically at lower resolutions.
How Does it Compare to How We Tested on 16C/16T
Interestingly, the results for almost all benchmarks were lower in 8C/16T mode over 16C/16T mode. Despite moving down to a single die worth of cores, it would appear that having the raw cores at the disposal counteracts most of the cross communication losses, especially if each die of cores preferentially communicates with its own DRAM channels where possible.
In the following table,
On the left is AMD's Game Mode vs Creative Mode.
On the right is SMT disabled vs Creative Mode.
Both non-Creative data sets have NUMA enabled.
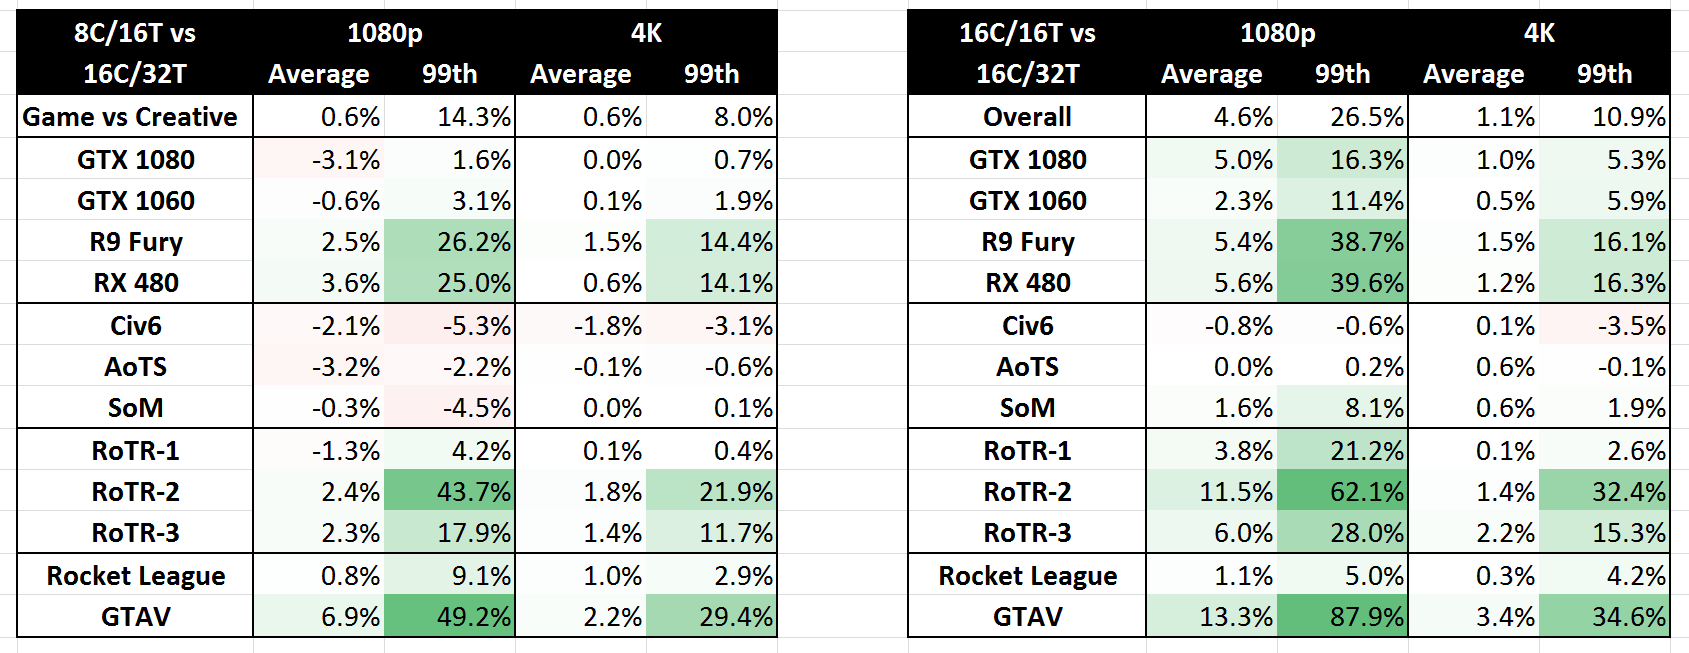
For example, at 16C/16T we saw a +4% average FPS improvement at 1080p, but now at 8C/16T this is only 0.6%. Before we had a +26.5% gain in 99th percentile numbers at 1080p, but now this is only +14.3%. The individual game numbers are matched similarly - on the right at 1080p at 16C/16T, we get an ~0.1% difference in the results for Game Mode compared to Creator mode, but on the left at 8C/16T we see an average loss of 3% for some of the tests. In the pure CPU benchmarks, at 16C/16T some benchmarks like Dolphin had a +33% increase, but at 8C/16T it is only a +9% increase.
The only upside to running at 8C/16T over 16C/16T would seem to be power consumption. In 8C/16T Game Mode, we saw an all-thread power consumption of 125W. In the non-SMT mode, this was 170W, closer to the default Creative Mode of 177W. One of AMD's reasons for implementing Game Mode like this was due to certain games not accepting the number of threads on offer - in the situations above, both of the new modes tested have 16 threads, at which point disabling SMT would appear to be preferable for performance.


104 Comments
View All Comments
Lieutenant Tofu - Friday, August 18, 2017 - link
"... we get an interesting metric where the 1950X still comes out on top due to the core counts, but because the 1920X has fewer cores per CCX, it actually falls behind the 1950X in Game Mode and the 1800X despite having more cores. "Would you mind elaborating on this? How does the proportion of cores per CCX affect performance?
JasonMZW20 - Sunday, August 20, 2017 - link
The only thing I can think of is CCX cache locality. Given a choice, you want more cores per CCX to keep data on that CCX rather than using cross-communication between CCXes through L2/L3. Once you have to communicate with the other CCX, you automatically incur a higher average latency penalty, which in some cases, is also a performance penalty (esp. if data keeps moving between the two CCXes).Lieutenant Tofu - Friday, August 18, 2017 - link
On the compile test (prev page):"... we get an interesting metric where the 1950X still comes out on top due to the core counts, but because the 1920X has fewer cores per CCX, it actually falls behind the 1950X in Game Mode and the 1800X despite having more cores. "
Would you mind elaborating on this? How does the proportion of cores per CCX affect performance?
rhoades-brown - Friday, August 18, 2017 - link
This gaming mode intrigues me greatly- the article states that the PCIe lanes and memory controller is still enabled, but the cores are turned off as shown in this diagram:http://images.anandtech.com/doci/11697/kevin_lensi...
If these are two complete processors on one package (as the diagrams and photos show), what impact does having gaming mode enabled and a PCIe device connected to the PCIe controller on the 'inactive' side? The NUMA memory latency seems to be about 1.35 surely this must affect the PCIe devices too- further how much bandwidth is there between the two processors? Opteron processors use HyperTransport for communication, do these do the same?
I work in the server world and am used to NUMA systems- for two separate processor packages in a 2 socket system, cross-node memory access times is normally 1.6x that of local memory access. For ESXi hosts, we also have particular PCIe slots that we place hardware in, to ensure that the different controllers are spread between PCIe controllers ensuring the highest level of availability due to hardware issue and peek performance (we are talking HBAs, Ethernet adapters, CNAs here). Although, hardware reliability is not a problem in the same way in a Threadripper environment, performance could well be.
I am intrigued to understand how this works in practice. I am considering building one of these systems out for my own home server environment- I yet to see any virtualisation benchmarks.
versesuvius - Friday, August 18, 2017 - link
So, what is a "Game"? Uses DirectX? Makes people act stupidly? Is not capable of using what there is? Makes available hardware a hindrance to smooth computing? Looks like a lot of other apps (that are not "Game") can benefit from this "Gaming Mode".msroadkill612 - Friday, August 18, 2017 - link
A shame no Vega GPU in the mix :(It may have revealed interesting synergies between sibling ryzen & vega processors as a bonus.
BrokenCrayons - Friday, August 18, 2017 - link
The only interesting synergy you'd get from a Threadripper + Vega setup is an absurdly high electrical demand and an angry power supply. Nothing makes less sense than throwing a 180W CPU plus a 295W GPU at a job that can be done with a 95W CPU and a 180W GPU just as well in all but a few many-threaded workloads (nevermind the cost savings on the CPU for buying Ryzen 7 or a Core i7).versesuvius - Friday, August 18, 2017 - link
I am not sure if I am getting it right, but apparently if the L3 cache on the first Zen core is full and the core has to go to the second core's L3 cache there is an increase in latency. But if the second core is power gated and does not take any calls, then the increase in latency is reduced. Is it logical to say that the first core has to clear it with the second core before it accesses the second core's cache and if the second core is out it does not have to and that checking with the second core does not take place and so latency is reduced? Moving on if the data is not in the second core's cache then the first core has to go to DRAM accessing which supposedly does not need clearance from the second core. Or does it always need to check first with the second core and then access even the DRAM?BlackenedPies - Friday, August 18, 2017 - link
Would Threadripper be bottlenecked by dual channel RAM due to uneven memory access between dies? Is the optimal 2 DIMM setup one per die channel or two on one die?Fisko - Saturday, August 19, 2017 - link
Anyone working on daily basis just to view and comment pdf won't use acrobat DC. Exception can be using OCR for pdf. Pdfxchange viewer uses more threads and opens pdf files much faster than Adobe DC. I regularly open files from 25 to 80 mb of CAD pdf files and difference is enormous.